
Page 32 - Spring 2006
P. 32
AUDITORY COMPRESSION AND HEARING LOSS
Sid P. Bacon
Psychoacoustics Laboratory, Department of Speech and Hearing Science, Arizona State University Tempe, Arizona 85287
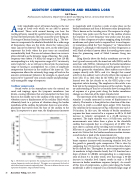
Atruly remarkable aspect of human hearing is the vast range of levels over which we are able to process sound. Those with normal hearing can hear the rustling of leaves caused by a gentle breeze as well as tolerate (at least for brief periods) the roar caused by a low-flying jet. The range of human hearing is illustrated in Fig. 1. The bot- tom curve represents the absolute thresholds for a wide range of frequencies; these are the levels where the various pure tones can just be detected. The top curve, on the other hand, represents the levels where the pure tones are considered uncomfortably loud. The area in between these two curves is often referred to as the dynamic range of hearing. For a mid- frequency tone (about 1–4 kHz), this range is at least 120 dB, corresponding to a truly impressive range of 1012 in intensity units (watts/m2). As we will see in this article, the enormous range of hearing is accomplished via a form of amplitude compression that exists in the cochlea of the inner ear. This compression allows the extremely large range of levels in the acoustic environment (inherent, for example, in speech and music) to be “squeezed” into a much smaller and physiologi- cally manageable range of responses.
Cochlear compression
Sound waves in the atmosphere enter the external ear canal and impinge upon the tympanic membrane (ear drum), causing vibrations that are transmitted via three tiny bones in the middle ear to the cochlea of the inner ear. This vibration causes a displacement of the cochlear fluids which ultimately leads to a pattern of vibration along the basilar membrane of the cochlea. In particular, there is a wave of dis- placement that travels from the base of the cochlea to the apex. In response to a pure tone, the displacement increases
in magnitude until it reaches a peak at some place on the
basilar membrane and then it decreases rather precipitously.
This is known as the traveling wave. The response to a high-
frequency tone peaks near the base of the cochlea whereas
the response to a low-frequency tone peaks near the apex.
There is thus a frequency-to-place mapping along the basilar
membrane; each place tends to respond best to one frequen-
cy (sometimes called the “best frequency” or “characteristic
frequency”), although it will respond to other frequencies as
well. Much of what is known about the traveling wave comes
from the pioneering work of Nobel Laureate Georg von
1 Békésy .
Lying directly above the basilar membrane are two dis- tinct types of sensory cells, the inner hair cells (IHCs) and the outer hair cells (OHCs). Movement of the basilar membrane results in stimulation of these cells, and the greater the move- ment the greater the stimulation. Most auditory nerve fibers synapse directly with IHCs, and it is thought that neural activity in the auditory nerve directly reflects the response of these cells. If so, then what do the OHCs do? As we have learned over the last decade or so, the OHCs play a very important role in hearing. The emphasis in this article is on their role in the compressive response of the cochlea. To gain an understanding of that, let us consider how the magnitude of response at a given point along the basilar membrane changes as a function of the input stimulus level.
The movement of the basilar membrane in response to a stimulus is usually measured in terms of displacement or velocity. That metric is then plotted as a function of the stim- ulus level, to yield a so-called input-output (I-O) function. The solid line in the main part of Fig. 2 illustrates one such I- O function. In this case, the velocity of basilar membrane response has been converted to a response in dB (a 10-fold increase in velocity corresponds to a 20-dB increase in response). The input stimulus was a 10-kHz tone, and the measurements were taken from a place in the chinchilla
2 cochlea that responds best to a frequency of 10 kHz . The
inset shows a cartoon of the traveling wave envelope to a 10- kHz tone at a given level. The arrow indicates the measure- ment site. Notice that the basilar membrane motion increas- es and reaches a peak at the measurement site.
As can be seen in Fig. 2, the magnitude of basilar mem- brane response increases with increasing stimulus level, but the growth is generally quite compressive. This is clear by comparing the I-O function with the linear function shown by the dashed line. Throughout its most compressive region (at moderate to high stimulus levels) the I-O function has a slope of about 0.2 dB/dB, corresponding to a compression ratio of about 5:1. In other words, over that range, a 50-dB increase in stimulus level (input) results in only a 10-dB increase in basilar membrane response (output). As a result of this type of compression, a given point along the basilar membrane is able to respond to an extremely large range of
Fig. 1. The bottom curve represents the sound pressure levels where pure tones of various frequencies can be just detected. The upper curve represents the levels at which those tones become uncomfortably loud. The area in between the two curves represents the dynamic range of human hearing.
30 Acoustics Today, April 2006
