
Page 24 - Summer 2007
P. 24
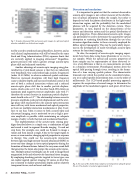
 Fig. 7. B-mode ultrasound (left) and acousto-optic images of a gel based optical absorber embedded in a chicken breast sample.
 Discussion and conclusions
It is important to point out that the contrast observed in acousto-optic images is not a direct measure of the distribu- tion of optical absorption within the sample, but rather it depends on both the photon distribution in the light/sound interaction region, and the probability that the modulated photons will be acquired by the detection system. These parameters, in turn, depend on the characteristics of the source and detection system and the spatial distribution of optical properties. Three-dimensional acousto-optic images can potentially be used to determine the quantitative optical absorption or scattering distribution through the use of an inversion algorithm similar to those currently employed for diffuse optical tomography. This may be particularly impor- tant in the development of multi-wavelength acousto-optic systems for functional imaging.
To date, the majority of acousto-optic imaging experi- ments have been done using tissue phantoms or ex-vivo tis- sue samples. While the optical and acoustic properties of these samples can be representative of those observed in- vivo, a key difference is that in-vivo measurements are made in a dynamic environment. Physiological motion alters the optical field passing through tissue, resulting in the forma- tion of a time varying speckle pattern. The characteristic timescale over which the speckle can be considered station- ary, or so called speckle decorrelation time, is on the order of milliseconds. The CCD based parallel processing approach requires the acquisition of several images to determine the amplitude of the modulated signal at each pixel. All of these
 ited by a need to avoid mechanical bioeffects, however, and as such clinical implementation will still be bound by the same Food and Drug Administration (FDA) exposure limits that
19
are currently applied to imaging ultrasound. Regardless,
greater pressures will yield a greater average acousto-optic phase shift and enhanced sensitivity.
Another advantage of acousto-optic imaging using pho- torefractive crystal-based sensors is that they are inherently very broadband. One could utilize high acoustic frequencies (order 10-50 MHz) to achieve enhanced spatial resolution. However, increased absorption will limit high frequency scans to shallow depths and increased resolution comes at the cost of both a reduced interaction volume and a reduced acousto-optic phase shift due to smaller particle displace- ments, which scale as 1/f. On the other hand, FDA limits on maximum peak negative pressure amplitudes scale with f1/2; therefore the actual decrease in maximum particle displace-
1/2
margin of safety re both thermal and mechanical bioeffects. The implementation of the acousto-optic sensing para- digm described above is a simple one; a combination of light and sound is used to augment B-mode imaging. It need not stop there. For example, one could use B-mode to image a tumor and then launch a single A-line in the target region to assess, or even monitor, changing optical properties in response to therapy. One could use the acousto-optic interaction between light and high intensity focused ultrasound (HIFU) to assess real time changes in tissue optical properties during the formation of thermal lesions. Indeed, the very same sound field that generates the lesion also pumps the acousto-optic interac- tion. Multiple optical wavelengths can be used to image blood oxygenation levels and otherwise do functional tissue imaging. By employing absorbing particles targeted to tissue types, one can realize targeted contrast imaging. Of course, in all of this, one is limited to shallow penetration depths and/or relatively
transparent tissues, such as breast and brain.
. The relationship between acoustic pressure amplitude, peak particle displacement and the aver- age phase shift encountered in the acousto-optic interaction zone will vary with tissue mechanical and optical properties, as there are multiple interaction mechanisms at play. It suf- fices to say that, when it comes to both acousto-optic and ultrasound imaging, one is motivated to use as high a pres- sure amplitude as possible while maintaining an adequate
ment should scale as 1/f
  22 Acoustics Today, July 2007
Fig. 8. X-Z scans of the chicken breast sample at several positions along the optical (Y) axis. The absorber is located at approximately Y= 0.
