
Page 17 - April 2008
P. 17
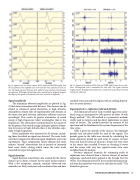
  Fig. 11. Signals at the stations GILA (left) and CHIR (right), from the six explo- sions. The amplitude scale is normalized for each trace. The signals represent weighted beams (bandpass filtered between 1-4 Hz) of the array elements steered towards the explosions.
 Fig. 10. Signals at the two closest stations, NW70 (left) and VANDAL (right), from the six explosions. The amplitude scale is the same for every explosion for each sta- tion. The signals represent the beam of the unfiltered array elements steered towards the explosions. With higher altitude (later shots, towards bottom of figure) the pulse- like shapes of the signals are broadened, with some variation in amplitude.
Signal amplitude
The maximum observed amplitudes are plotted in Fig. 13 that shows attenuation with distance. This decrease can be related to enhanced sound absorption at high altitudes. Atmospheric density falls off exponentially with altitude, so the mean free path between molecular collisions increases accordingly. This results in greater attenuation of sound energy at high frequencies (short wavelengths) than at low frequencies. The attenuation is proportional to the square of the frequency, thus sound energy undergoes greater attenua- tion for sources at high altitudes than at low altitudes, espe- cially at high frequencies.
Noise amplitudes were measured at all stations, includ- ing those for which no signal was detected. The noise levels were then compared to observed signal amplitudes across the experiments. These comparisons clearly indicate that some stations “missed” observations due to periods of increased local noise levels—during which times the noise levels exceeded the expected signal levels.
Signal duration
Signal duration varied from a few seconds for the closest stations up to about a minute for the more distant stations. With a few exceptions, azimuth residuals (observed–true azimuths) are fairly consistent with no obvious bias and have
standard errors around five degrees with no striking depend- ence on array distance.
Signal period vs. explosion yield and altitude
The dominant period of each recorded signal was calcu- lated using an autoregressive (AR) process of order 16 with Burg’s method.21 The AR method is a parametric method, widely used in statistics and has direct applications in many areas of interest. The method provides an estimate of the spectrum and the fundamental (or system) frequencies of the time series.
Table 2 gives the altitude of the sources, the dominant periods and calculated yields for each of the signals. The periods given in the table were derived by calculating the mean dominant period for each array of sensors (at least four) and then the mean of all arrays. Arrays that were close to the source that recorded N-waves or decaying N-waves and the arrays with very low signal-to-noise ratio were excluded from the analysis.
Previous empirical formulas for estimating yields of explosions were derived from a historic dataset of nuclear explosions conducted above ground at the Nevada Test Site (NTS). The dominant period of the recorded infrasound sig-
nal from the explosions was used to calculate the yield. formula is given as:
22
The
Infrasound Calibration Experiments 15
