
Page 18 - April 2008
P. 18
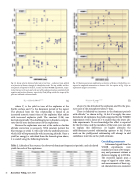
  Fig. 13. Maximum pressure amplitude as a function of distance. Dashed lines cor- respond to amplitude attenuation as distance-1.36. See caption to Fig. 12 for an explanation of figure conventions.
 Fig. 12. Group velocity, distance/(observed arrival time – explosion time), plotted as a function of distance (range) for identified arrivals. The top, middle, and bot- tom panels correspond to the first, second, and third WSMR experiments, respec- tively. Stations to the west and to the east of the explosion locations are plotted with negative and positive distances, respectively. Data falling outside the ranges of the plots are indicated with arrowheads.
 (1)
where Y0 is the yield in tons of the explosion at the Earth’s surface and T is the dominant period of the signal. The physical basis for this relationship is found in an increased acoustic transit time of the explosion blast radius with increased explosive yield. The constant (2.38) was derived empirically. The doubling factor in brackets compen- sates for the non-nuclear nature of the explosions.
Because the explosions were not at the surface a further altitude correction is necessary. With constant period, the blast energy, or yield, Y, will scale with the ambient pressure, which falls off exponentially with increasing altitude. Once a yield (or energy) is calculated from the formula given above, it is scaled using the following formula:
  (2)
where Z is the altitude of the explosion and H is the pres- sure scale of the atmosphere (about 7 km).
There is definitely an increase in the dominant periods with altitude,16 as shown in Fig. 14, but if we apply the same formula for all explosions the yields computed for the WSMR3 experiments were a factor of 2–4 smaller than the lower alti- tude experiments. To our knowledge this effect is reported for the first time, and the members of the team were not able to explain this difference. At higher altitudes the yield/dominant period relationship appears to fail. Future work on the yield/period relationship will attempt to add confidence intervals on the yield estimates.
Concluding comments
Infrasound signals from the WSMR experiments were recorded at 24 out of 30 tempo- rary and permanent stations at distances ranging up to 900 km. The recorded signals span a range of signal to noise ratios, and measurements of basic sig- nal characteristics are consistent
 Table 2. Altitude of the sources, the observed dominant frequencies/periods, and calculated yields for each of the explosions.
16 Acoustics Today, April 2008
