
Page 10 - October 2010
P. 10
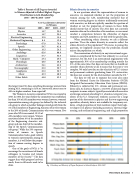
 Table 4: Percent of All Degrees Awarded
to Women Adjusted to Reflect Highest Degree Distribution in ASA Membership,
1995 – 1997 & 2005 – 20078
% OF ALL DEGREES AWARDED TO WOMEN
 SUBJECT 1995 – 1997 2005 – 2007
 Physics 14.7 20.0
 Acoustics 14.7 20.0
 Electrical Engineering 10.9 15.4
 Mechanical Engineering 8.6 12.8
 Psychology 67.9 74.4
 Speech 59.7 61.8
 Other Engineering 16.5 24.3
 Audiology 82.6 88.9
 Linguistics 57.7 64.6
 Math / Computer 23.4 26.0
 Physiology 48.6 49.8
 Architecture 34.1 42.9
 Oceanography 26.0 39.7
 Geophysics 26.0 39.7
 Music 46.3 48.9
 Other Fields 44.8 52.3
  this larger trend. Or does something discourage women from joining ASA, remaining in ASA or, conversely, attract men to ASA in higher numbers than expected?
The Women in Acoustics committee (WIA) was created in
1995. In 1990, five years before the committee was established,
less than 10% of ASA members were women; however, women’s
representation among sub-groups (as defined by the technical
sub-group to which a member belongs) varied greatly from the
1% of the members of Engineering Acoustics who were women
to the 28% of Speech Communication who were women. Five
years after WIA was created, 13.5% of
ASA members were women. Women
constituted about 4% of the members
of the Engineering Acoustics sub-
group and one-third of the member-
ship of the Speech Communication
9
sub-group. While the 33% represen-
tation of women in Speech Communication looks good relative to women’s representation among all members, it is well below the propor- tion of women earning degrees in speech.
One of the goals of WIA is “to encourage the recruitment of female colleagues to become and remain members of the Society.”10 The data suggest that, while progress has been made, there is still much work to be done.
Ethnic diversity in acoustics
In our questions about the representation of women in acoustics, we examined whether or not the proportion of women among the ASA membership mirrored that of women receiving degrees in subjects traditionally associated with acoustics; we did not explicitly consider the question of whether or not the proportion of women in these fields should mirror that of society. The ASA does not currently maintain data on the ethnicities of its members, so we cannot conduct a comparison between the ethnicities of degree recipients and ASA members as we did with the gender data.
When considering ethnic diversity, we ask a different question: “Does the ethnic diversity in acoustics reflect the ethnic diversity of the population?” Of course, in posing this question, we implicitly assume that the profession should mirror the population as a whole.
The examination of ethnicity in any international organ- ization is complicated by the fact that ethnicity is a national construct, but the ASA is an international organization with approximately 30% of its membership residing outside the U.S. At the same time, that does not mean that we should not consider ethnic diversity at all; it means that the issue is very complex. We only have data on the ethnicities of U.S. citizens and permanent residents graduating from U.S. universities;
11
this does not account for the ASA members outside the U.S. The data we will use to examine this issue also come from the National Center for Education Statistics (NCES) Integrated Postsecondary Education Data System (IPEDS). Ethnicity is collected for U.S. citizens and permanent resi- dents only. As shown in Figure 1, over 60% of doctoral degree recipients in some subjects typically associated with acoustics are foreign nationals attending U.S. schools as temporary res- idents of the U.S. Temporary residents account for a large portion of the doctorates in physics and the two engineering specialties; ethnicity data is not available for temporary resi- dents. A high proportion of ASA members report their high- est degree is in physics (including acoustics), electrical engi- neering, and mechanical engineering, and a high proportion
 Fig. 1. Residency and Ethnicity of Degree Recipients in Selected Subjects: 2005–2007.
Diversity in Acoustics 9
