
Page 8 - October 2010
P. 8
WHAT CAN WE LEARN ABOUT DIVERSITY FROM STATISTICS ON ACOUSTICS?
Susan White and Rachel Ivie
Statistical Research Center American Institute of Physics College Park, Maryland 20740
“Is this low representation among women simply a reflection of the academic disciplines associated with ASA members?”
Concerns about diversity in the the data for the fifteen academic fields
acoustics community have
recently led to the formation of
the Committee on Diversity in
Acoustics (CDA). The CDA held its
first meeting on May 21, 2009, at the
157th Acoustical Society of America
(ASA) meeting in Portland, Oregon.
This committee was formed to explore
and propose activities designed to
attract members of underrepresented groups to the profes- sion of acoustics and to encourage underrepresented mem-
1
bers to join the ASA. At that meeting, the CDA held a joint
session (“Diversity Issues in Education in Acoustics”) with the Education Committee. We presented this information as a talk at the session and are pleased to share our findings more broadly through Acoustics Today. We will examine both gender and ethnic diversity in fields traditionally asso- ciated with acoustics, and we will compare our findings with ASA demographics where available.
Gender diversity in acoustics
A profile of the ASA membership reports that 15.2% of ASA members are women.2 We ask, “Is this low representa- tion among women simply a reflection of the academic disci- plines associated with ASA members?”
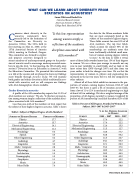
Less than one-sixth of the members of ASA report that the subject of their highest degree is acoustics. Table 1 shows
that are most commonly listed as the
subject of the member’s highest degree.
These fields account for over 92% of all
ASA members. The top four fields,
which account for almost 60% of the
membership, are academic areas that
have traditionally exhibited small num-
bers of women earning degrees relative
4
to men. As the data in Table 2 reveal,
most of these fields awarded more than 15% of their degrees to women. We use a three-year average to smooth out any year-to-year variability in small fields, and we look at the most recent data (2005 through 2007) and data from ten years earlier to look for changes over time. We see that the representation of women in physics and engineering has increased in the last ten years, but it is still low compared to other subjects.
Almost all of these fields exhibit an increase in the pro- portion of women earning degrees between 1995–97 and 2005–07, but there is quite a bit of variation across fields, from a low of 11 to 12% in mechanical engineering to a high of about 95% in audiology. We take a weighted average of the proportion of all degrees awarded to women (weighted by percent of ASA membership6) and find that about 32% of the
Table 2: Percent of All Degrees Awarded to Women, by Subject, 1995–1997 & 2005–20075
% OF ALL DEGREES AWARDED TO WOMEN
SUBJECT 1995 – 1997 2005 – 2007
Physics 17.4 22.2
Acoustics 17.4 22.2
Electrical Engineering 12.4 15.5
Mechanical Engineering 11.3 12.7
Psychology 72.9 77.7
Speech 62.8 66.2
Other Engineering 21.5 24.7
Audiology 94.1 95.3
Linguistics 67.1 69.3
Math / Computer 35.2 27.6
Physiology 48.6 56.2
Architecture 38.3 44.5
Oceanography 33.8 43.2
Geophysics 33.8 43.2
Music 49.3 46.5
Other Fields 56.0 58.8
Table 1: Subject of Highest Degree of ASA Members3
SUBJECT OF HIGHEST DEGREE PERCENT OF MEMBERS
Physics 17.7
Acoustics 15.7
Electrical Engineering 14.1
Mechanical Engineering 11.2
Psychology 6.4
Speech 5.3
Other Engineering 5.2
Audiology 4.7
Linguistics 3.0
Math / Computer 2.8
Physiology 1.6
Architecture 1.5
Oceanography 1.3
Geophysics 1.1
Music 1.0
Other Fields 7.4
Diversity in Acoustics 7
