
Page 9 - October 2010
P. 9
degree recipients in these fields in the 1995–97 time period were women; by 2005–07, it had increased to almost 36%. Thus, we would expect about one-third of ASA members to be women. However, given that less than one-sixth of ASA members are women, perhaps we are overlooking other fac- tors that can explain this discrepancy.
The age distribution of ASA’s members might explain the low representation of women in ASA. Over one-half of the members of ASA are 50 years old or older. We would expect the graduates from 1995–97 to have an average age between thirty-five and forty years old and those from 2005–2007 to be between twenty-five and thirty, on average. Only 9% of ASA members are under age 30 (the 2005–07 graduates); 18% are between 30 and 39. Just as the proportion of women earning degrees increased from the mid-1990s to the mid- 2000s, it also increased in the years prior to the mid-1990s. So, the proportion of the older ASA members who are women would be less than one-third.
Adjusting for the age distribution of the membership reduces the proportion of members expected to be women to about 23%. The age distribution apparently explains some of the difference between the proportion of ASA members we would expect to be women and those that are women; how- ever, there is still a fairly significant gap between the 23% women we expect to find and the 15% women that we do find.
Are we overlooking other factors that could account for this apparent disparity? Yes, most ASA members have earned an advanced degree, and a lower proportion of women earn advanced degrees rather than bachelor’s degrees. About two- thirds of ASA members have earned a doctorate; 18% have a master’s degree, and about 11% hold a bachelor’s degree as
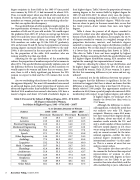
their highest degree. Table 3 shows the proportion of women earning degrees in the various fields by highest degree for 1995–97 and 2005–2007. In almost every case, the propor- tion of women earning doctorates in a subject is lower than the proportion earning bachelor’s degrees. While the num- bers are closer to parity in the more recent data, we see that the trend persists—fewer women than men earn higher degrees.
Table 4 shows the percent of all degrees awarded to women by subject area after adjusting for the degree distri- bution of ASA members. For physics, for example, the 14.7% of degrees awarded to women is a weighted average of the proportion doctorates, master’s, and bachelor’s degrees awarded to women using the degree distribution profile of ASA members. We see that almost every data point in Table 4 is lower than the corresponding data shown in Table 2. (The data in Table 2 have not been weighted by highest degree.) Perhaps accounting for both the age distribution and the highest degree distribution among ASA members will explain the seemingly low representation of women.
However, adjusting by subject, by age distribution, and by highest degree suggests that about 19% of ASA’s mem- bers should be women. Only 15.2% are women. Is it possi- ble that this remaining difference is just noise and not sig- nificant?
A statistical test for the difference between two propor- tions suggests that this difference is significant. In fact, the statistical test suggests that there is almost no chance that this difference is just noise; the p-value is less than 0.01. If we ran- domly selected 7,000 people (the approximate number of members in ASA) from a pool of people who mirrored ASA’s membership with respect to age, highest degree, and subject
of highest degree, we would get 15.2% females (or fewer) less than twice in 1*109 draws.
Although the difference is statisti- cally significant, it should be noted that our analysis uses only U.S. degree recipients. However, some ASA mem- bers have earned their degrees abroad. In addition, about one-third of ASA members reside outside the U.S. and only a small number of these members will have earned degrees in U.S. Since we are using data from U.S. institutions only, we cannot account for the inter- national segments—neither the inter- national degree recipients nor the international members—in this analy- sis. This is a source of error that our analysis cannot reduce.
This analysis also does not tell us the reasons for the lower than expected representation of women in ASA. Perhaps women with degrees in these disciplines are less likely to go into acoustics than into other fields, and the ASA membership is just a reflection of
Table 3: Percent of by Subject & Highest Degree, 1995 – 97 & 2005 – 20077 All Degrees Awarded to Women,
by Subject & Highest Degree, 1995 – 97 & 2005 – 20077
% OF DEGREES AWARDED TO WOMEN
SUBJECT 1995 – 1997 2005 – 2007
DOCTORATE BACHELOR’S DOCTORATE BACHELOR’S
Physics 13.3 19.0 18.3 22.3
Acoustics 13.3 19.0 18.3 22.3
Electrical Engineering 10.0 12.1 14.6 13.3
Mechanical Engineering 7.5 11.6 12.7 12.6
Psychology 65.6 73.3 72.5 77.6
Speech 57.1 62.3 57.9 65.8
Other Engineering 14.4 23.1 23.7 24.5
Audiology 77.5 94.2 85.7 95.9
Linguistics 53.2 70.5 61.8 69.0
Math / Computer 19.7 34.2 24.7 26.3
Physiology 41.6 80.0 47.6 60.4
Architecture 31.9 35.5 42.3 43.7
Oceanography 22.6 35.6 37.4 42.8
Geophysics 22.6 35.6 37.4 42.8
Music 44.0 49.9 48.1 49.1
Other Fields 40.1 55.3 49.4 57.5
8 Acoustics Today, October 2010
