
Page 42 - Acoustics Today Summer 2011
P. 42
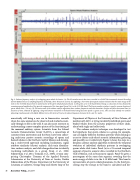
                                          Fig. 5. Cadence frequency analysis of overlapping sperm whale click trains. (a) The 25 second acoustic data inset, recorded on a LADC Environmental Acoustic Recording System (EARS) buoy at a sampling frequency of 192 kHz, shows bioacoustic activity. (b) Applying a short-time spectrogram analysis indicates that the main energy of the clicks in the 5-10 kHz band, which is representative of the sperm whale phonation band. (c) The green curve is the band-limited energy as a function of time, obtained by summing squared amplitudes of the spectral components of the time signal (panel (a)) in the 5-10 kHz band. The Fourier analysis window is equal to a mean duration of sperm whale clicks (~10 ms). (d) The main result of the cadence analysis algorithm shows cadence frequencies and their harmonics (bright red-yellow horizontal lines) as functions of time, obtained by applying a long-time Fourier transform to the band-limited energy function (panel (c) green curve). One can easily identify two animals phonating simultaneously with slightly different intra-click interval (inverse of cadence frequency) between the 8 s and 15 s marks.
 acoustically will bring a new era in bioacoustics research when the same animal can be observed and studied acousti- cally through its life in the wild. It can also assist scientists in understanding a more complete picture of the functioning of the mammal auditory system. Scientists from the Littoral Acoustic Demonstration Center (LADC), a consortium of scientists from universities and the Navy, have been collect- ing multi-year passive acoustic recordings of sperm and beaked whales in the Northern Gulf of Mexico and develop- ing a multi-tiered approach including localization, signal attribute similarity (cluster) analysis, click train identifica- tion, cadence analysis, and click change detection to identify vocalizing individuals in a group (Ioup et al., 2009; Sidorovskaia et al, 2011; Tiemann et al., 2006). A team com- prising Christopher Tiemann of the Applied Research Laboratories at the University of Texas at Austin, Natalia Sidorovskaia of the Physics Department of the University of Louisiana at Lafayette, George Ioup and Juliette Ioup of the
 Department of Physics at the University of New Orleans, all members of LADC, is trying to identify individual sperm and beaked whales from the acoustic properties of their clicks, taken both singly and collectively.
The cadence analysis technique was developed to test the hypothesis that sperm whales in a group, for example, can use slightly different rhythmic patterns while clicking so as not to clutter each other’s acoustic information gathering and possibly use it collectively. Figure 5 shows the steps in a dynamic cadence analysis algorithm to identify the temporal evolution of individual rhythmic patterns in overlapping sperm whale click trains. Panel (a) is a 25 second temporal segment of passive acoustic data, recorded in the Northern Gulf of Mexico, rich in bioacoustic signals. Panel (b) gives a spectrogram of the same data segment, revealing that the main energy of clicks is in the 5-10 kHz band. This band is representative of sperm whale phonations. In the third pro- cessing step the energy in the band is calculated and dis-
38 Acoustics Today, July 2011
