
Page 44 - Acoustics Today Summer 2011
P. 44
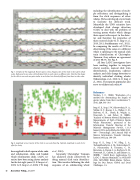
                                          Fig. 7. Overplot of the magnitude Fourier spectra versus frequency for all the clicks in five sperm whale codas. Each panel is one coda, with individual clicks in each coda in a different color. Note that the shapes for the clicks in one coda are quite similar to each other, but distinctly different from those in other codas.
  Fig. 8. Amplitude versus time for all the clicks in one coda from Fig. 3 plotted. Amplitude in each click is offset for clarity.
been applied to both sperm whale coda and echolocation clicks and beaked whale echolocation clicks. LADC sci- entists have been using cluster analysis for the last eight years (G. E. Ioup et al., 2005; G. E. Ioup et al., 2009; J. W. Ioup
et al., 2010).
Separately Christopher Tiemann
has analyzed clicks collectively by doing manual click train identifica- tion. This involves following the click sequence of an echolocating whale
including the identification of multi- ple reflections, and distinguishing it from the click sequences of other whales. He has developed several tools to facilitate the difficult work. Meanwhile the UNO scientists have developed click change detection (CCD) to deal with the problem of turning sperm whales which change their aspect with respect to the detec- tor and therefore the properties of their received clicks (G. E. Ioup et al., 2010, 2011; Starkhammar et al., 2011). In comparing the results of CCD in determining if the same or a different whale is speaking to the manual click train identification of Christopher Tiemann, they achieve an agreement of over 98.5%. See Fig. 9.
All four LADC investigators have been working together to integrate cluster analysis, manual click train identification, localization, cadence analysis, and click change detection to identify individual clicking whales (Sidorovskaia et al., 2010; G. E. Ioup et al., 2011). The separate approaches also serve to validate each other.AT
References
Gordon, J. C. (1991) “Evaluation of a method for determining the length of sperm whales from their vocalizations,” J. Zool., 224, 301–314
Ioup, G. E., Ioup, J. W., Sidorovskaia, N. A., Walker, R. T., Kuczaj, S. A., Walker, C. D., Rayborn, G. H., Brack, B., Wright, A., Newcomb, J., and Fisher, R. (2005), “Analysis of Bottom-Moored Hydrophone Measurements of Gulf of Mexico Sperm Whale Phonations,” presented at the Information Transfer Meeting of the Minerals Management Service, 11-13 January 2005, and published in MMS 2005- 066 – Proceedings: 23rd Annual Gulf of Mexico Information Transfer Meeting, January 2005, pp. 109-136.
Ioup, G. E., Ioup, J. W., Pflug, L. A., Tashmukhambetov, A. M., Sidorovskaia, N. A., Schexnayder, P., Tiemann, C. O., Bernstein, A., Kuczaj, S. A., Rayborn, G. H., Newcomb, J. J., Carlson, R., and Ekimov, A., (2009). “ EARS Buoy Applications by LADC: I. Marine Mammals,” in OCEANS 2009, MTS/IEEE Biloxi-Marine Techno- logy for Our Future: Global and Local Challenges, 1-9.
40 Acoustics Today, July 2011
