
Page 43 - Acoustics Today Summer 2011
P. 43
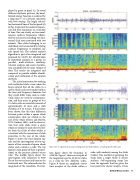
                                         played in green in panel (c). To reveal different rhythmic patterns, the band- limited energy function is analysed by a long-time (~11 s) Fourier transform with 99% overlap. The bright red-yel- low horizontal lines of the last panel (d) of Fig. 5 represent the cadence frequen- cies and their harmonics as a function of time. One can clearly see two simul- taneous cadence frequencies (identi- fied by red arrows) encoding two fine- turned click rates associated with two animals. Thus clicks belonging to an individual can be associated by relating cadence frequencies to temporal sig- nals (panel (a)). The cadence analysis algorithm is part of an integrated tool proposed by LADC for identification of individual animals in a group. In parallel, multi-attribute similarity (cluster) analysis and source localiza- tion are applied to the same volume of data. The results are integrated and compared to provide reliable identifi- cation and verification of the separate methods.
The initial motivation for working with individual clicks came when the Ioups noticed that all the clicks in a sperm whale coda were similar both in the time and frequency domains, but they could differ from coda to coda. Coda clicks are used for communica- tion, and they occur in groups of 6 to 15 clicks with an interclick interval of approximately 40 msec and a click duration of 3 to 6 msec. It had earlier been shown that the time difference between peaks within a sperm whale echolocation click are related to the size of the whale (Norris and Harvey, 1972; Gordon, 1991), and the observa- tion that coda clicks from a given whale are similar to each other but dif- fer from the clicks of other whales is consistent with the connection of click properties to the size of the whale. Figure 6 shows the time domain sig- nals and the spectrograms of two seg- ments of four seconds of sperm whale clicks; each contains a coda. The top figure in each group of three is propor- tional to the pressure plotted versus time. The middle figure shows the spectrogram with frequency to 6000 Hz on the vertical axis and time on the horizontal axis. The color indicates the magnitude of the transform. The bot-
  Fig. 6. Two 4-s segments of acoustic recordings from the Gulf of Mexico, containing sperm whale codas.
 coda, with similarity among the clicks evident. One method of grouping the clicks from a single whale is cluster analysis. Self-organizing maps has been the approach that has given the best results for cluster analysis. It has
 tom figure shows the frequency to 1000 Hz. Figure 7 shows an overplot of the magnitude spectra of all the clicks in a coda for five different codas. Figure 8 shows an amplitude versus time overplot of the clicks within a
Animal Bioacoustics 39
