
Page 23 - Acoustics Today
P. 23
lenge algorithms and visualization schemes.
An online guide to bioacoustical software can be found at:
http://zeeman.ehc.edu/envs/Hopp/sound.html. Table 3 provides links to several software packages that are designed to expedite processing of large bioacoustical data sets. This includes refer- ences to software that supports machine learning models, which offer a diverse array of tools for classifying sounds.
Examples illustrating potential scale
The authors have been involved in several large scale projects to monitor natural sounds. The National Park Service Natural Sounds and Night Skies Division has moni- tored acoustic resource conditions at hundreds of sites in park units across the United States. These data include 1/3rd octave, 1-second equivalent continuous noise level (Leq) measurements to characterize ambient sound levels, and audio recordings to help identify common sounds and docu- ment their prevalence. In recent systems, a Roland R-05 has been used to obtain continuous audio recordings. Figure 1 illustrates a recent deployment in Zion National Park. An area of ongoing research is developing models that help gen- eralize these point measurements of acoustical conditions into park and regional maps that illustrate the distribution of spatially varying acoustical conditions.
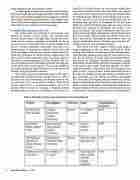
Many other acoustical monitoring projects will seek to automatically identify particular sounds of interest. Table 4 illustrates the size and eventual classification accuracy that was obtained in the course of those analyses. Three of the projects used Raven, a commercial product one of the authors helped initiate by securing a National Science Foundation grant to fund its development. The fourth uti-
lized XBAT, a Matlab library one of the authors helped fund to pursue the project listed in the table. Raven was a logical choice for the first three projects because of its flexible tools for displaying large volumes of acoustical data and its exten- sive user manual—a real benefit for collaborators who are analyzing large quantities of recordings for the first time. XBAT was used for the fourth project because more selective detection was required to distinguish the sounds of the species of interest. The authors’ familiarity with these pro- grams was an overriding consideration; other packages could have been equally effective. Raven and XBAT were used to detect and extract standardized measurements from the sounds, and Random Forest20 classifiers were trained to dis- criminate between true and false detections.
The screech owl study21 sought to detect a wide range of sounds originating in the nest boxes, produced by adults, nestlings, and embryos. The proximity of the microphone pro- vided favorable signal-to-noise ratios for most classes of sig- nals, but the diversity of sounds called for generalized detec- tion based on frequency bandlimited acoustic energy. Kozlowski reviewed and identified tens of thousands of sounds to provide the data set that trained the classifier. The black- capped vireo study22 utilized more than 80 spectrogram tem- plates to detect 5 types of notes. Several other bird species at the study site produced sounds that closely resembled each of these note types, so it was difficult to achieve a manageable false alarm rate. Spectrogram selection involved an iterative process of identifying missed detections, and selecting tem- plates to capture those signals, and eliminating templates that became redundant. The last two projects document the success of collaborators who pursued their analyses with limited guid-
Table 4. Examples of large scale automated acoustic classification
22 Acoustics Today, July 2012
