
Page 38 - Acoustics Today
P. 38
assumed that no clicks at greater than 8 km horizontal range could be detected, so the area surveyed was a = 82 × 𝜋 × 82 = 16,487 km2. The problem was to build on these numbers to derive a density estimate.
Marques et al. (2009) used a cue count approach, treat- ing the echolocation click as the cue. In addition to the above information, four multipliers were required. Two account for the detection process—false positive rate, c, and average detection probability, p. Two convert density of clicks to den- sity of animals—the click production rate, r, and the time spent monitoring T. Hence the formula used was
(2)
This makes intuitive sense if we think of 𝑛 × (1 − cˆ) as an esti- mate of the true number of Blainville’s clicks detected, accounting for false positives. Dividing this by 𝑝ˆ gives an esti- mate of the true number of Blainville’s clicks produced, accounting for those missed. The quantity 𝑟ˆ 𝑇 is an estimate of the average number of clicks produced per whale over the time T, so dividing the estimated total number of clicks pro- duced 𝑛 × (1 − cˆ) / pˆ by the estimated number produced per whale 𝑟ˆ T gives an estimate of the number of whales. Dividing this by the area a gives an estimate of whale density, and hence the formula shown above.
The problem now becomes one of obtaining reliable val- ues for the multipliers. Time spent monitoring was known (T = 4,961 minutes, accounting for some data outages), and so does not have a hat. Estimating the other multipliers required some additional data.
For false positives, a systematic random sample of 30 10- minute recordings was hand-screened for false detections, yielding an estimated false positive rate of cˆ = 0.451. This is rather high, due to the simple nature of the detection and classification system used, where dolphin clicks were often confused with beaked whale clicks. The fact that 30 random recordings were used enabled calculation of uncertainty in this estimate—the CV was 1.99%. In other words, although
the average false positive rate was high, its’ value was esti- mated quite precisely and so did not contribute much to the overall uncertainty in the density estimate. Because it was calculated from a random sample taken from the 6-day data set used for density estimation it is also unbiased—i.e., it is correct, on average, for the 6-day period in which we are interested. If we wanted to estimate density for some other time period, the safest thing would be to take a new system- atic random sample of times from that period and re-calcu- late the false positive rate. False positive rates vary according to the density of interfering sounds—in our case dolphins were the main problem, and the density of dolphins could be completely different in another time period. This illustrates a general principle with multipliers—it is best to estimate them using data from the time and place from which you want to estimate density. For false positives this is relatively tractable (so long as we have some raw sound files or other pertinent information from the survey data, and trust human analysts as the gold standard). For other multipliers it may be less so.
A good example of this is the data used to obtain cue rate and detection probability in this study. These data come from a sample of Blainville’s beaked whales fitted with digital recording tags, “DTAGs,” in fall 2006 and summer 2007 as part of another study within the same area. DTAGs record sound at high sampling rate, as well as kinematic variables that enable the animal’s track to be reconstructed.5 The sound recordings were processed, and clicks produced by the tagged whales were counted, yielding an estimated cue rate of 𝑟ˆ = 0.407 clicks/second. Each of the 21 dives was considered to be an independent sample, yielding a CV 9.8%. The 21 dives actually came from 5 whales, so there is a potential issue there with non-independence of dives within whales (biologists call this issue “pseudoreplication”). But a more important issue is that we assumed the cue rate of these whales, tagged in 2006 and 2007, is representative of cue rates of an average whale during the 6-day period we wish to esti- mate density for in 2005, when there were no tagged animals. This assumption may be reasonable here, since beaked
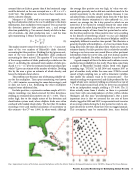
Fig. 1. Approximate location of the bottom-mounted hydrophones within the Atlantic Undersea Testing and Evaluation Center (AUTEC), Tongue of the Ocean, Bahamas.
Passive Acoustic Monitoring for Estimating Animal Density 37
