
Page 24 - Volume 8, Issue 4 - Winter 2012
P. 24
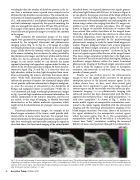
wavelengths than the number of absorbers present in the tis- sue, then a minimum mean squared error estimate can be obtained for the absorber concentrations. The estimated con- centrations of deoxyhemoglobin, oxyhemoglobin, nanoparti- cle 1, and nanoparticle 2 are displayed using blue, red, green, and violet colormaps, respectively. For spectral unmixing, the data was averaged into voxels of size 500 μm 200 μm 300 μm. The images of the optical absorbers were overlaid on co-reg- istered ultrasound grayscale images to visualize the anatomy in the region.
High resolution 3D anatomical images of the tumor region were generated by processing the ultrasound signals received by the integrated ultrasound and photoacoustic imaging system (Fig. 5). In Fig. 5a, a 3D image of a single wavelength photoacoustic image, overlaid on the ultrasound image, clearly shows the anatomy within the imaged region of the mouse, including the vasculature (in color, provided by the photoacoustic image), and the layer of skin and the femur within the leg (in greyscale, provided by the ultrasound image). In our mouse model we can identify the tumor regions by locating two hypoechoic regions under the skin, as shown in the 2D ultrasound slice in Figure 5b. From the pho- toacoustic signal (Fig. 5c and 5d), it is clear that there are light absorbers within the skin, light absorption from vascu- lature surrounding the tumors, and from the tumors them- selves. While both ultrasound and photoacoustic images indicate the presence of tumors, the anatomical images alone do not provide sufficient information to diagnose malignan- cy, since the accuracy of ultrasound in the distinction of benign and malignant tumors is insufficient.30 While the in vivo ultrasound and single wavelength photoacoustic images in Fig. 5 provide high resolution anatomical information, the cellular composition of the tumor is unknown, and thus we are unable, at this stage of imaging, to identify functional characteristics or the cellular molecular expression, which might aid in the identification of a benign versus cancerous tumor.
Functional photoacoustic images, for example of the blood oxygen saturation of the tumor, could provide addi- tional criteria to assess tumor function. We acquired func- tional information by detecting photoacoustic signals at mul- tiple laser wavelengths and spectrally unmixing the signals as described above. For functional imaging of the animal model
described above, we acquired photoacoustic signals generat- ed by laser light between 680-850 nm. As shown in Figure 6, we can observe the oxygen saturation of the blood within the “normal” tissue and within the tumor regions. The estimated concentrations of deoxyhemoglobin and oxyhemoglobin are shown using a color scale ranging from blue (0% oxygen sat- uration) to red (100% oxygen saturation). The 3D image shown in Figure 6a indicates distinction of venuous flow from arterial flow within vasculature of the imaged tissue. While the study of vasculature has relevance to some niches of medical diagnostics, more significantly, we can use the functional information provided by the multiwavelength photoacoustic imaging to study the tumor blood oxygen sat- uration. Hypoxic malignant tumors have a worse prognosis, making the blood oxygen saturation useful for the assess-
31
periods of tumor growth.
Finally, we can further process the photoacoustic
images to view the signal which correlates to the optical absorption spectra of the injected contrast agents. In the studies shown here, we have used silica-coated gold nanorods, but it important to note that a large variety of contrast agents can be successfully used for molecular pho- toacoustic imaging;32 in vivo photoacoustic imaging with enhanced contrast has been demonstrated with the FDA- approved dye methylene blue,33 with gold nanospheres,27 or
34
with silver nanoplates. As shown in Fig. 7, within our
mouse model, regions of nanoparticle accumulation corre- spond to the tumor regions identified with the ultrasound imaging and the functional photoacoustic imaging of the blood oxygen saturation. Over time, there is an increase in the signal attributed to the nanoparticle contrast agents within the tumor region (Fig. 7b, c). The accumulation of nanoparticles could be due to two effects. It is known that tumors have “leaky” vasculature, enabling the increased delivery of nano-sized particles through the enhanced per-
As shown in Fig. 6b, there is a hypoxic region within the core of the imaged tumor. This lower oxygen saturation is likely due to the high meta- bolic activity of the cells located within that region, leading to insufficient oxygen delivery within the tumor. Functional photoacoustic imaging of the blood oxygen saturation could be used to study the response of the tumor to therapeutic treatment, non-invasively, in real-time, and over long time
ment of therapy and therapy response.
  Fig. 7. In vivo molecular imaging of contrast agent accumulation within a targeted tumor. The multiwavelength photoacoustic signal was unmixed into two components cor- responding to two different contrast agents, nanoparticle 1 (NP1) and nanoparticle 2 (NP2). (a) 2D overlay of ultrasound image, distribution of NP1 and NP2 before the injection of the contrast agent, showing minimal background photoacoustic signal. Accumulation of NP1 and NP2 within the tumor is shown (b) 8 hours and (c) 24 hours after intravenous injection. Scale bars = 1 mm.
20 Acoustics Today, October 2012
