
Page 23 - Volume 8, Issue 4 - Winter 2012
P. 23
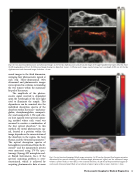
  Fig. 5. In vivo anatomical photoacoustic and ultrasound images. (a) 3D overlay of photoacoustic and ultrasound images of the upper leg/abdominal region. Blue box shows the 2D imaging plane of (b-d). (b) Ultrasound image showing two hypoechoic tumors. (c) Photoacoustic image, acquired using a laser wavelength of 850 nm. (d) Overlay of photoacoustic and ultrasound images. Scale bars = 2 mm.
 sound images in the third dimension, averaging four photoacoustic signals at each step. Three-dimensional (3D) ultrasound and photoacoustic images were captured in a volume surrounding the two tumors within the mammary fat pad of the mouse.
The amplitude of the photoa- coustic signal received is dependent upon the wavelength of the laser light used to illuminate the sample. This dependence can be unmixed into the individual absorption spectra of the absorbers within the tissue—oxyhemo- globin, deoxyhemoglobin, nanoparti- cle 1 and nanoparticle 2. We used a lin- ear least squared error spectral unmix- ing method where each voxel was assumed to contain a combination of
27
the four optical absorbers. In this
method, the initial photoacoustic sig- nal, located at a position within the image, depends on the concentration of the absorbers in the region, the laser
28
fluence, and the Grüneisen parameter. The optical absorption spectra of hemoglobin were obtained from the lit- erature29 and the nanoparticle spectra were measured using UV-Vis spec- troscopy (Synergy HT microplate read- er, Biotek Instruments, Inc.). If the spectral unmixing problem is over- constrained, which is achieved by acquiring photoacoustic data at more
 Fig. 6. In vivo functional imaging of blood oxygen saturation. (a) 3D overlay of percent blood oxygen saturation, determined from spectral unmixing of the multiwavlength photoacoustic signal, and the ultrasound image. Volume is 23 mm (wide) x 6 mm (tall) x 7 mm (scanned direction). (b) 2D slice of the percent blood oxygen sat- uration and ultrasound signal. Black arrow indicates a hypoxic region within a tumor. Scale bars = 2mm.
Photoacoustic Imaging for Medical Diagnostics 19
