
Page 14 - Volume 9, Issue 3
P. 14
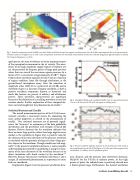
                                  Fig. 7. Overall sound pressure levels (OASPL) near the F-35AA and F-22A aircraft (one engine) at military power. For the F-35AA measurements, the circles represent meas- urement locations at a height of 1.5 m, with a cubic interpolation in between. For the F-22A measurements, the data was collected along planes approximately 2 m tall and 23 m long and along an arc at 23 m.
 aged spectra, the time waveforms reveal an important aspect of the perceptual environment in the jet vicinity. The wave- forms of the high-amplitude signals typical of military jets are characterized by frequent pulses of large peak pressure values that can exceed the root-mean-square pressures by a factor of 10: a crest factor of approximately 20 dB!39,29 Figure 9 shows short waveform segments for the F-22A as a function of engine condition, from idle through afterburner, at the ground-based microphone array. Note the transition in amplitude scales (4000 Pa is a peak level of 166 dB) and in waveform shape as a function of engine condition, as both a positive waveform asymmetry (known as skewness) and shock-like features are present at military and afterburner powers. These waveform characteristics are significant because of the definition of a crackling waveform as one that contains shocks. Further exploration of these temporal fea-
40
The overall measurement aperture of the F-35AA meas- urement provides a convenient means for examining the noise spatial properties as related to the phenomenon of crackle. Two statistical measures are of potential signifi- cance: the “skewness” or asymmetry of the data probability distribution and the prevalence and strength of shock-like features. Positive skewness for the waveform indicates that there are more large positive values than large negative ones, similar to the waveform in Figure 9(a). A positive value for the skewness of the time derivative of the pressure waveform is correlated with the presence of sharp rise times (large pos- itive slopes) in the waveform. Though crackle was tied origi- nally24 to the pressure waveform’s skewness, a more complete understanding has pointed to quantifying it using the asym- metry of the time derivative of the waveform because of its
34,40
 tures can lend insight into the phenomenon of crackle.
Statistical Features and Crackle
Fig. 8. Unweighted (black) and A-weighted OASPL (red) at a ground-based array 11.6 m to the side of an F-22A with one engine at military power.
  direct correlation with shock content in the waveform. However, because the pressure waveform’s skewness is also a unique, ill-understood phenomenon in supersonic jet noise, both are considered.
Displayed in Figure 10 are the pressure waveform’s skew-
Fig. 9. Pressure waveform segments measured 15.2 m downstream of the nozzle at the ground-based array for the F-22A Raptor at (a) idle, and with one engine at (b) intermediate, (c) military, and (d) afterburner power.
 ness, Sk{p(t)}, and the pressure time derivative’s skewness, Sk{∂p/∂t} for the F-35AA at military power. At this high power set point, the radiated noise is positively skewed over a broad spatial range. Furthermore, the skewed waveforms
Jet Noise from Military Aircraft 13
