
Page 15 - Volume 9, Issue 3
P. 15
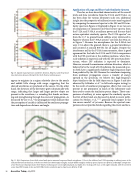
                                  Fig. 10. Spatial map of pressure waveform’s skewness, 𝑆𝑘{𝑝(𝑡)}, and the pressure time-derivative skewness, 𝑆𝑘{𝜕𝑝/𝜕𝑡} for the F-35AA at military power.
appear to originate in a region relatively close to the nozzle and exhibit little change with range, suggesting that the skewed waveforms are produced at the source. On the other hand, the skewness of the derivative grows dramatically with range, indicating that larger and larger positive slopes are present in the waveform, i.e. revealing that shocks are form- ing and strengthening through the course of propagation. As discussed by Gee et al.,40 the propagation trends indicate that the perception of crackle is influenced by nonlinear propaga- tion and depends on distance and angle.
Application of Large and Fine-Scale Similarity Spectra
Thus far, we have described characteristics of the overall levels and time waveforms from the F-22A and F-35AA. As has been done for various laboratory-scale jets, additional insight into the properties of military jet noise may be gained by comparing the measured spectra to the LSS and FSS sim- ilarity spectra in Figure 4. Displayed in Figure 11 are two sets of comparisons of measured one-third octave spectra from the F-22A and F-35AA at military power and the one-third octave equivalent similarity spectra. The F-22A spectra41 are from the 11.7 m ground-based sideline array referenced in Figure 8, whereas the F-35AA spectra42 are from the 38 m arc in Figure 7. Because the microphones for the F-35AA test were 1.5 m above the ground, there is a ground interference null centered at around 800 Hz for all angles. Despite the interference null in the F-35AA measurements, there is good agreement for the both the F-22A and F-35AA comparisons with the FSS spectrum at the sideline positions, where fine- scale radiation is expected, and with the LSS spectrum down- stream, where LSS radiation is expected to dominate. However, around the maximum radiation direction, which is believed to be the result of LSS radiation, the measured spec- tra both have a significantly shallower high-frequency slope than predicted by the LSS. Because the waveform steepening from nonlinear propagation causes a transfer of energy upward in the spectrum, we believe this high-frequency slope (similar to the far field slope seen in Figure 5 and also
43
observed by Schlinker et al.
in full-scale engine testing) to be the result of nonlinear propagation effects that were not present or not prominent in much of the laboratory-scale data used to create the similarity spectra shapes. These com- parisons of military jet noise against the similarity spectra, the first of their kind, are discussed in detail in recent publi- cations by Neilsen et al.,41,42,44 generally lend support to the two-source model19 of jet noise. Because the spectral com- parisons do not provide details regarding the extent and loca-
  Fig. 11. Left: Comparison of one-third-octave band spectra measured on ground-based microphones 11.6 m to the sideline of an F-22A operating at military power, at the indicated downstream distances, with the one-third octave FSS (empty triangles) and LSS (filled triangles) similarity spectra. Spectra are offset by 25 dB. Right: Comparison of one-third-octave band spectra for the F-35AA at military power on microphones placed at a height of 1.5 m along a 38 m arc. at the angles indicated, with the one-third octave band FSS (empty circles) and LSS (filled circles) similarity spectra. Spectra are offset by 20 dB.
14 Acoustics Today, July 2013
