
Page 24 - \Winter 2015
P. 24
Worldwide Low-Frequency Ambient Noise
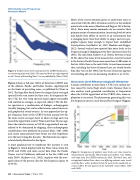
Figure 4. Ambient noise levels measured at the CTBTO hydroacous- tic monitoring stations for 2010. The reported levels are superimposed on the “Limits of Prevailing Noise” curves published by Wenz (1962).
Figure 4 shows a full year (2010) of data from CTBTO sites in the Atlantic, Pacific, and Indian Oceans, superimposed on the limits of prevailing noise, as published by Wenz in 1962. The large blue band shows the range of year-averaged spectral levels seen across the three sites. At frequencies be- low 5 Hz, the very steep spectral slopes appear reasonably well centered as averages, as expected. Above 5 Hz, the flat- ter spectrum is a combination of biologic, anthropogenic (usually shipping, but can be other human-caused sources), and geophysical sound sources. As one approaches the up- per frequency limit of the CTBTO System around 100 Hz, the more recent averages move to above average and even exceed the upper limit seen by Wenz more than 50 years ago. Since the acoustic sources, as 100 Hz is approached, are con- sidered to be dominated by shipping, those anthropogenic contributions were predicted to increase (Ross, 1987, 1993) and recent measurements have borne out that hypothesis over the intervening five decades. This behavior was expect- ed and clearly illustrated in the figure.
A more graphical way to emphasize this increase is seen in Figure 5, which displays both the Wenz values from the 1950’s and 1960’s and more recent data from the Pacific Ocean, west of California, collected in the late 1990’s and early 2000’s (Andrew et al., 2002), together with the aver- aged values of the present data for the frequency region 10 to 60 Hz.
Much of the recent attention given to underwater noise is concerned with the effect of human activity on the ambient noise levels in the ocean (Hawkins and Popper, 2014; Ketten, 2014). Since many marine mammals rely on sound as their primary means of communication, increasing levels of noise may hinder their ability to survive in an environment that is changing faster than their ability to adapt, and over geo- graphic regions large enough to impact their established travel patterns (Southall et al., 2007; Hawkins and Popper, 2012). Several studies have reported that noise levels in the frequency range of shipping activity have increased since the 1960s. The data from Andrew et al. (2002), between 10 and 60 Hz, shows that noise levels measured at a receiver located in the Eastern Pacific Ocean were more than 10 dB louder in the late 1990s than in the mid-1960s. Several measurement sites, including the three of interest here, are clearly louder than they were in the 1960s, but the rate of increase appears to be leveling off, or even decreasing (Andrew et al., 2011).
Acoustic (and Meteorological) Weather
A major contributor to noise from 1-5 Hz is sea surface mo- tion caused by storm (high wind) events. Because there is also another wind generated contribution at frequencies above the 100 Hz upper limit of the CTBTO data, some ex- planation is necessary. The phenomena generating this very low frequency noise is a non-linear effect (Longuet-Higgins,
Figure 5. Comparison of ambient noise levels over time, based on measurements reported by Wenz (1962) and Andrew et al. (2002), with data from the CTBTO stations for 2010. The black lines, and extrapolated dashed lines, show two differing ambient noise trends noted by Ross, with a prediction that the noise levels would only in- crease 5 dB in the last quarter of the twentieth century (Ross, 1987 and 1993).
22 | Acoustics Today | Winter 2015
