
Page 25 - \Winter 2015
P. 25
1950) resulting from two ocean surface waves that are trav- eling toward one another and their consequent interaction, creating a standing wave which results in a pressure change sensed by the hydrophone(s). Below 5 Hz, it has been noted that the amplitude of the pressure variations produced by the Longuet-Higgins mechanism correlate well with surface wind speeds (McCreery et al., 1993).
As winds blow along the surface of the sea, surface waves start to develop, which increase in amplitude as wind speeds increase. Logically, surface wave heights can only increase up to a certain point before they start to break, limiting the height of a wave. Since longer wavelength waves can support higher amplitude than shorter wavelength waves before the onset of breaking, the height limit of a surface wave is de- pendent on its frequency. For oceanic surface waves of fre- quencies between about 0.1 and 10 Hz, this limiting height spectrum, often referred to as a “saturation spectrum”, is proportional to frequency-5 (Pierson and Moskowitz, 1964).
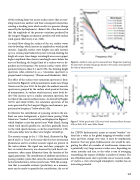
The effect of the surface wave saturation spectrum is dem- onstrated in Figure 6, with measurements made near Diego Garcia over the year 2010. In this plot, the ambient acoustic spectrum is grouped by the surface wind speed at the time of measurement. As surface winds increase, noise levels be- low 5 Hz increase up to a similar saturation spectrum, but not that of the acoustic ambient noise. As derived by Hughes (1976) and Lloyd (1981), the saturation spectrum of the noise generated by the Longuet-Higgins mechanism is pro- portional to frequency-7 below about 5 Hz.
To illustrate the contribution of a passing storm to the am- bient sea noise background, a typical storm passing Wake Island was “tracked” acoustically and displayed in Figure 7, which displays a nine day period near Wake Island, during which wind speeds quickly rise, and then gradually decay. As the wind speeds increase, so do the sound levels at 1 Hz, with some delay time to allow wave heights to build up.
The acoustic energy in the 1 -5 Hz band, illustrated in Fig- ures 6 and 7, is "local" in the sense that the wave interaction phenomena and its resultant acoustic signal are present in the water column. The signal can, and does, propagate. In fact, its initial discovery was observed by land based seis- mometers, often many kilometers from the location of the signal generation. The contribution of ambient noise from a passing weather system that enters the sound channel noted in the introduction is still a research issue. With the assump- tion that a reasonable estimate (prediction), or a measure- ment can be made to quantify that contribution, the use of
Figure 6. Ambient noise spectra measured near Diego Garcia during the year 2010, divided into groups based on the surface wind speed at the time of measurement.
Figure 7. Wind speeds and 1 Hz noise levels measured from January 16th to 25th, 2010, near Wake Island.
the CTBTO hydroacoustic arrays as remote "weather" sta- tions has a value in the global mapping of weather condi- tions and their change over time. It must be emphasized, however, that any given hydroacoustic site would be inte- grating the effect of a number of simultaneous storms over a potentially very large oceanic surface area, depending on storm intensity and size, so the value is one of averaging (smoothing) the impact of (likely) a number of storms. The use of hydroacoustic sites to provide, via an "acoustic weath- er" metric, a view of averaged atmospheric weather, has an interesting potential.
| 23
