
Page 26 - \Winter 2015
P. 26
Worldwide Low-Frequency Ambient Noise
What do you mean,
“Biologics”?
The answer expected is “A North At-
lantic Right Whale mother signal-
ing its calf to ‘stay close.’” A conun-
drum faced in underwater acoustics
and one of its consequences is the
use of words like “seismic events,”
“distant shipping,” or “biologics”
to describe sources of sounds that
clearly should have much more
precise definitions. A value of the CTBTO data sets is the opportunity to examine hundreds, if not thousands, of “events,” and to consequently isolate those events that have a common source. To be sure, enormous advances have been made in the marine biology world, as each form of life has a taxa, hence a specific source can be (and is) identified and associated with a received and catalogued acoustic signal. (Stafford et al., 2004; Neukirk et al., 2012).
Searching for methods to isolate specific source functions leads to the application of a correlation technique that has been used (Nichols and Sayer, 1977; Curtis et al., 1999; Nich- ols and Bradley, 2013, 2014), where the frequency content of a specific signal is displayed in a manner that emphasizes the correlation (or similarity) between (or lack thereof) a partic- ular frequency value and other frequencies, also contained in the same signal. The technique appears to provide unique and repeatable “structures” for a number of those sources that are typically labeled by a generic title such as “seismic event.” The technique, illustrated in Figure 8, displays the correlation coefficient between spectral levels at two fre- quencies for a period of time (in the figure, it is one year, but the time "window" selected would be driven by the time associated with a particular phenomenon, or an estimate, if an actual measurement is not available).
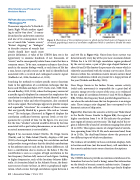
Figure 9 (a)-Ascension Island (North), (b) Diego Garcia (North), and (c) Wake Island (North), displays a full year (2010) of averaged behavior using this correlation method and provides strong evidence that the detailed contributions to the ambient noise at each site has distinct differences. All have a contribution due to storms at the below 5 Hz; this contribution is seen as a region of high correlation in the low frequency (bottom left) corner of each figure. Looking to higher frequencies, each of the locations behaves differ- ently. At Ascension Island in the Atlantic Ocean, the domi- nant source of noise (at least, in 2010) is geophysical explo- ration, which creates the high correlation region between 4
24 | Acoustics Today | Winter 2015
Figure 8. Illustration of the correlation process in which spectral levels pairs of frequencies are correlated, populating a matrix of correlation coefficients which is symmetric around the main diagonal.
and 100 Hz in Figure 9(a). Noise from these surveys was detected nearly every day of the year near Ascension Island. Within the 4 to 100 Hz high correlation region produced by the survey noise, a pair of plus-sign shaped features at about 18 and 26 Hz denotes the presence of a source which is relatively uncorrelated with the seismic survey noise. These features within the correlation matrix denote narrow-band whale vocalizations which are present for a large portion of the year (Nichols and Bradley, 2013).
Near Diego Garcia in the Indian Ocean, seismic activity (solid earth movement) is responsible for a great deal of acoustic energy over the course of the year, as is evidenced by the region of correlation between 5 and 30 Hz in Figure 9(b). Within this frequency band, parallel diagonal lines oc- cur where the ratio between the two frequencies is an integer ratio. These integer ratio diagonal lines correspond to the harmonic nature of ship noise.
Figure 9(c) illustrates the acoustic activity near Wake Island in the Pacific Ocean. Similar to Figure 9(b), the region of higher correlation from 3 to 18 Hz indicates the predomi- nant region of seismic activity noise. The high end of this re- gion is followed by a band of correlation ranging from about 18 to 22 Hz. This region consists of a larger band of correla- tion, spanning from 18 to 22 Hz, and a narrower band, from 19 to 20 Hz. The dual-band feature shows the presence of two different types of whale vocalizations.
The richness of variability in these correlation displays, both in location and time (not discussed here), will contribute to the acoustic ambient noise source function descriptions.
Summary
The CTBTO data sets provide an enormous storehouse of in- formation that can be (and is being) mined for information on the details of oceanic acoustic ambient noise. Compari- son with similar data collected decades ago clearly displays
