
Page 15 - 2016Winter
P. 15
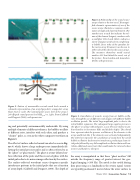
    Figure 5. Pattern of measureable received sound levels around a schematic representation of an array (gray dots); orange dots: array floats; (not to scale). The nominal point source level of the array is 260 dB peak sound pressure level (SPLpeak) re 1 μPa. From Caldwell and Dragoset (2000), with permission.
ing and potentially environmentally undesirable. By using multiple elements of different volumes, the bubbles oscillate at different rates, interfere with each other, and produce a “cleaner” pulse, as seen in the white composite waveform in Figure 6.
The effect of surface-reflected sound can also be seen in Fig- ure 6, which shows a large underpressure immediately fol- lowing the initial pressure pulse and is often referred to as the “ghost” or “ghost notch.” The ghost is a time-delayed sur- face reflection of the pulse and thus is out-of-phase with the initial pulse due to its mirror image reflection by the surface. The surface-reflected wavefront causes frequency-specific interference patterns in the initial pulse that are a function of array depth (Caldwell and Dragoset, 2000). The depth of
Figure 4. Relationship of the sound source arrays relative to the tow vessel. The magni- fied schematic representation of one of the source arrays illustrates a common combi- nation of single and clustered elements. The number next to each dot indicates the vol- ume of the element (airgun); numbers with a multiplier 155×3 and 195×3, indicate a cluster of airguns used to form a single larg- er bubble. Inset: wake of the spreaders for the receive array (streamers) can be seen to either side of the side-by-side source arrays. The streamers themselves would extend another 4-12 km behind the vessel, out of the picture. From Landrø and Amundsen (2010), with permission.
Figure 6. Cancellation of acoustic energy from air bubble oscilla- tions through the use of different-sized airguns with different bubble oscillation periods. The initial large-amplitude pulse is due to the initial bubble expansion. The subsequent large negative pressure is the “ghost” or surface-reflected pulse. y-axis: Pressure relative to am- bient baseline in bar-meters (left) and decibels (right). The colored lines represent what the pressure oscillations of the elements in the array would look like if the elements were activated independently. The white line represents the cancellation of sound from the varied bubble oscillations by destructive interference, producing a clean ini- tial pulse followed by very little amplitude oscillation that would con- tribute additional wave fronts that would make the returned echoes messier and harder to interpret.
the array is manipulated so that these “ghost notches” fall outside the frequency range of greatest interest for geo- logical imaging (<100 Hz). The notch is also useful during data processing as a landmark in the return signal. Arrays are typically positioned 6 meters below the water surface to
  Winter 2016 | Acoustics Today | 13
