
Page 52 - 2016Winter
P. 52
Speech Production Research
similar devices suggests that either something is still missing from the voicing source models or that we do not yet know how to control them properly” (Klatt, 1987, pp. 745-746). Since 1987, several studies have resulted in improvements to the synthesis of female speech. Klatt and Klatt (1990) im- proved naturalness using voice quality variation. Karlsson (1992) enhanced naturalness beyond the parameters con- trolled in traditional synthesis of male speech by adding ex- tra formants, a noise-modulated fundamental frequency, a vocal fry component, and an improved voice source model. Subsequent work by Karlsson and Neovius (1994) address- ing both source and filter problems has led to even more natural-sounding synthesis of female voices.
Myth 3: Two-Dimensional Images and Models Sufficiently Represent Three-Dimensional Structures Like the Tongue
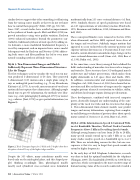
The first techniques used to visualize the vocal tract in mo- tion produced 2-dimensional (2-D) data. They projected 3-dimensional (3-D) motion onto a single plane using X- rays or midsagittal point tracking (e.g., X-ray Microbeam; Kiritani et al., 1975). As a result, measurements of vocal tract motion did not capture three dimensions. Although people found ways to get 3-D information, the methods were labo- rious (e.g., static palatography [Ladefoged, 1957]) or inexact (e.g., cadavers [Fant, 1970]) or gave partial information (see Figure 2).
Figure 2. The 3-D tongue shapes for /i/ (left) and /l/ (right) show how deceptive a lateral X-ray of the highest edge would be.
Despite the 3-D efforts, many articulatory models were based only on the midsagittal plane, and this shaped peo- ple’s thinking accordingly. Thus, physiological models mostly used cylindrical cross-sectional areas formulated
mathematically from 2-D cross-sectional distances (cf. Fant, 1970). Similarly, theories of speech production were based on 2-D representations of articulatory motion (Hardcastle, 1976; Browman and Goldstein, 1989; Saltzmann and Mun- hall, 1989).
These conceptual blinders were removed in the late 1980s when ultrasound, and later MRI, captured tissue slices of the tongue and vocal tract. Suddenly, tongue motions that appeared to occur exclusively in the anterior-posterior and superior-inferior directions on 2-D projection X-rays were found to contain dramatic nonuniform shape changes in the cross-sectional dimension as well (Stone et al., 1988; Baer et al., 1991; Badin et al., 2002).
At the same time, a new theory emerged that redefined the field’s understanding of muscular structures such as tongues and tentacles. These structures have 3-D orthogonal muscle architecture and volume preservation, which makes them highly deformable in 3-D space (Kier and Smith, 1985). In addition, neuromuscular and anatomical explorations (Slaughter et al., 2005; Stone et al., 2016) have shown that in- nervation and fiber architecture of tongue muscles support complex patterns of muscle coactivation to stabilize, stiffen, and deform local tongue regions during speech motions.
These developments, combined with increased computer power, drastically changed our understanding of the com- plexity of the vocal tract tube and the structures that shape it. Three-dimensional finite-element models now predict tongue and airway deformation, capturing their complex- ity and allowing reevaluation of previous ideas about speech motor control (cf. Stavness et al., 2012, Bijar et al., 2015).
Myth 4: All the Information in Speech Is Contained With- in a Set Bandwidth. Therefore, We Don’t Need to Consider Frequencies Above 5 kHz in Describing Speech Sounds. Although young humans can hear from 20 Hz to 20 kHz, many speech sounds extend up to only 7 kHz or so, and many studies analyze speech in a bandwidth up to 4 or 5 kHz. There are interlocking reasons for this, but one con- sequence is that it is easy to forget that speech sounds do extend to higher frequencies.
In the early days of Bell Telephone Laboratories, research was done to find the optimal bandwidth for the telephone (Flanagan, 2009). The bandwidth of 300 Hz to 3,500 Hz was agreed on, which corresponds to the most sensitive range of human hearing. Some of the research conducted revealed a
50 | Acoustics Today | Winter 2016
