
Page 53 - 2016Winter
P. 53
high degree of redundancy in speech. For instance, filtering out all sound above 1,800 Hz reduced intelligibility to 67%, but filtering out all sound below 1,800 Hz also reduced intel- ligibility to 67% (Moore, 1997). Miller and Nicely’s (1955) study of consonant confusions that result from limiting the bandwidth and adding noise to the transmitted signal de- scribed in detail which consonants are misperceived in the various conditions.
A further contributing factor is the way in which sound propagation in the vocal tract is modeled. If only acoustic propagation of plane waves is considered, the wave equa- tion simplifies to be analogous to the equations governing voltage and current in electrical circuits, as shown by Fant (1970, pp. 27-36). This allows sound propagation in the vo- cal tract to be modeled as a transmission line and for cir- cuit theory and linear system theory to be used. One conse- quence is that nonplane wave modes cannot be predicted by such models. These cross modes begin to propagate (rather than dying out) above about 4-5 kHz for typical vocal tract dimensions. Above this limit, the plane wave modes still ex- ist and are predicted correctly, but because the cross-modes are not predicted, the estimated sound spectrum is progres- sively less accurate.
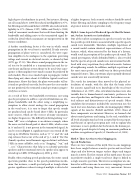
As a result of these two bandwidth restrictions, one using speech perception to address a practical limitation on tele- phone bandwidths and the other using a simplifying as- sumption to allow circuit analogs for sound propagation in the vocal tract, it is easy to forget that speech sounds are produced and can be heard above 5 kHz. In particular, noise sources, which are the essence of many consonants, use higher frequencies. The difficulty of distinguishing “esss” from “efff” over a telephone is an obvious example, where the noise-excited broad peak at about 6 kHz, which occurs in /s/ and not /f/, is not present in the transmitted signal. As can be seen in Figure 1, significant noise can extend all the way up to 20 kHz for fricatives such as “f,” “s,” and “sh,” and stop releases that occur at the end of “p, t, and k.” For this (female) speaker, vowel formants appear distinct well above 5 kHz in some syllables, such as in “shopping,” “sun,” and “...sses.” Characteristics that help us to identify particular speakers and the emotional state of a speaker also appear to extend up to 8 kHz (O’Shaughnessy, 2000, p. 452).
Finally, when studying speech production, the entire sound spectrum provides clues to the speech production mecha- nism. For instance, a small spectral peak or trough attains greater significance when its integral multiple is detected at
a higher frequency. Such acoustic evidence should be noted before filtering and down-sampling to the frequency range of greatest interest for a particular study.
Myth 5: Some Aspect of Produced Speech Must Be Invari- ant, Such as Acoustics or Articulation
One of the earliest assumptions in speech research was that the specific spectral features associated with a specific speech sound were immutable. Therefore, multiple repetitions of a sound would contain identical representations of these features, which, when extracted by the brain of a listener, would result in perception of the spoken speech sound. The sound spectrogram, which debunked Myth 1, also revealed that the spectra of speech sounds were not invariant but dif- fered with every repetition; they reflected acoustic features of neighboring sounds. In addition, multiple repetitions of the exact same speech task could vary in their spectral and temporal features. Thus, repetitions of perceptually identical sounds were not acoustically invariant.
The search for invariance then moved to the physical ar- ticulation of sounds, with the idea that the brain refers the acoustic signal back to its knowledge of the vocal tract (Liberman et al., 1967). Alas, articulator motions were also variable due to biomechanical constraints, preference for ease of production, and linguistic rules that enhance acous- tical salience and distinctiveness of speech sounds. Other candidates for invariance included the constriction size, the vocal tract area function, and the electromyography (EMG) signals of the muscles (Perkell and Klatt, 1986). None of these components was invariant. However, we learned a lot about control patterns and timing. In the end, variability at all levels of production has been accepted for the most part, and theories of speech perception now seek to explain why invariance is not a problem for the brain in the human per- ception of speech despite its being an enormous problem in machine recognition of speech (cf. Guenther et al., 2006).
Myth 6: There Are One-to-One Mappings in
Speech Production
There are two versions of this myth. One-to-one mappings have been sought between acoustic spectra and vocal tract shape and also between tongue surface shapes and tongue muscle activity. The first variant of this myth arose because in predictive models, a single vocal tract shape is linked to a single acoustic spectrum. The inverse assumption was em- braced as well because one-to-one inverse mappings seemed reasonable and using them was very convenient. Inverse
Winter 2016 | Acoustics Today | 51
