
Page 55 - 2016Winter
P. 55
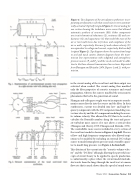
 Figure 4. Two diagrams of the articulatory synthesizer incor- porating aerodynamics such that sound sources were automat- ically activated. Top half (original Figure 1): Circuit analog for one section showing the turbulence noise source that allowed automatic synthesis of consonants (PN). Other components are circuit elements of inductance (L), resistance (R) and con- ductance (G), and capacitance (C) that model the mass of the air or tract wall, losses due to friction, and compliance of the air or walls, respectively. Pressure (p) and volume velocity (U) are equivalent to voltage and current, respectively. Bottom half (original Figure 2): Top diagram shows the system from lungs to oral and nasal cavities. Bottom diagram shows the trans- mission line representation with subglottal and atmospheric pressure sources (PS and PA) and the vocal cord model in addi- tion to the three-element transmission line sections. Reprinted from Flanagan and Ishizaka (1976, Figures 1 and 2), with per- mission.
in the circuit analog of the vocal tract and their output was activated when needed. The circuit analog thus modeled only the filter properties of acoustic resonance and sound propagation, whereas the sources modeled the aeroacoustic phenomena that led to the generation of sound.
Flanagan and colleagues sought ways to incorporate aerody- namics more directly into the source and the filter. In their synthesizers, current was divided into low- and high-fre- quency components with the DC component modeling con- vection velocity and the AC component modeling the acous- tic volume velocity. This allowed the DC flow to be used to calculate the Reynolds number along the tract and gener- ate turbulent noise sources if it rose above a critical value (Flanagan and Cherry, 1969; Flanagan and Ishizaka, 1976). The controllable noise source included in every section of the vocal tract model is shown in Figure 4, top half. The use of low- and high-frequency components also allowed respi- ration to be modeled by including an external DC voltage source to model atmospheric pressure and a variable capaci- tor to model lung pressure (see Figure 4, bottom half).
This division of the current into the “acoustic volume veloc- ity” and the “DC flow,” although allowing the powerful con- cepts of circuit theory to be applied to speech production, is, unfortunately, a place where the circuit model misleads. Air travels from the lungs through the vocal tract at a mean flow rate that is much slower than the speed of sound waves
 Winter 2016 | Acoustics Today | 53
