
Page 38 - 2018Fall
P. 38
Adrian KC Lee
Postal:
Department of Speech and Hearing Sciences Institute for Learning & Brain Sciences (I-LABS) University of Washington Portage Bay Building, Room 206 Box 357988 Seattle, Washington 98195-7988 USA
Email:
akclee@uw.edu
Imaging the Listening Brain
Different neuroimaging tools can help us discover how our brains selectively listen to one voice in a crowded environment.
Introduction
At every Acoustical Society of America (ASA) meeting, we mingle in one big hall at the conference venue and socialize. Some like to catch up with old friends; oth- ers continue in deep discussions about all things acoustic. Most listeners without hearing loss can “tune in” to a voice of interest and “tune out” everything else in a crowded environment; more than six decades ago, this behavioral challenge was first coined in The Journal of the Acoustical Society of America (Cherry, 1953) as the “cocktail party problem.” Many listeners, especially the younger trainees, can achieve this feat effortlessly (Figure 1). However, picking out a single acoustical source from a mixture available to the listener’s ears is not trivial; even state-of- the-art machine-learning algorithms can not yet reliably achieve this task (but see the latest deep-learning approach taking us closer to this lofty computational goal;
Wang, 2017).
Why is it so dif- ficult to solve the cocktail party problem (Middlebrooks et al., 2017)? It is impossible to work out what (and how many) sound sources have been added to create a given acoustic mix- ture because this is a math- ematically ill- posed problem. Fortunately,
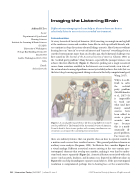
Figure 1. A casual gathering of the Lee lab discussing different research articles published in The Journal of the Acoustical Society of America. It can be hard to listen to one speaker with so many simultaneous con- versations occurring in this cocktail party environment.
there are auditory features that can provide clues on how to separate sounds in a mixture and recover their veridical sources. This general problem is known as auditory scene analysis (Bregman, 1990). To illustrate this, consider Figure 2 as a visual analogy. Different acoustical sources arriving at the ears contain spec- trotemporal elements that overlap one another, making it very hard to under- stand each source separately (Figure 2a). Acoustical features associated with each source (such as pitch, loudness, and location cues, depicted in different colors in Figure 2b) can help disambiguate separate sound objects. If the spectrotemporal resolution is compromised, perhaps due to hearing loss, or the acoustical fea-
36 | Acoustics Today | Fall 2017 | volume 13, issue 3 ©2017 Acoustical Society of America. All rights reserved.
