
Page 50 - 2017Spring
P. 50
High-Frequency Ultrasound Applications
son for this split is that the posterior pole of the eye, where the optic nerve, macula, and retina are located, is approxi- mately 25 mm from the surface of the eye (Figures 1 and 2). Although the eye is largely filled with the vitreous gel, which at lower frequencies produces minimal attenuation, at fre- quencies above about 20 MHz, the long path length through the vitreous gel produces too much attenuation to provide a gray-scale image that reveals the posterior pole with an ade- quate signal-to-noise ratio (SNR). Although ultrasound can provide fairly deep penetration >1 cm, the relatively poor resolution provided by 10-MHz probes (about 150 μm axi- ally by 450 μm laterally) has made optical coherence tomog- raphy, which provides an order of magnitude of superior resolution to a depth of about 1 mm, the preferred imaging modality for evaluation of the retina and optic nerve head. HFU, however, still has advantages because of its ability to visualize optically occult structures such as the ciliary body and the space behind the sclera (the white of the eye) and iris where optical methods cannot penetrate.
Commercial ophthalmic ultrasound systems typically sup- port multiple transducers. For instance, Quantel Medical’s Aviso system (Clermont Ferrand, France) supports a 10-MHz probe for axial length determination (crucial for cataract surgery); 10- and 20-MHz probes for imaging the vitreous gel, posterior pole, and orbit; and 25- and 50-MHz probes for imaging the anterior segment (Figure 2). In contrast, the ArcScan Insight1 system (Golden, CO) is highly specialized, using a focused 35-MHz transducer that is scanned in an arc matching the curvature of the cornea so that the corneal surface is maintained at the focus at normal incidence dur- ing scanning.
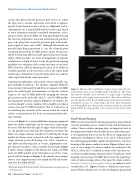
As seen in Figure 2, current ophthalmic imaging equipment limits the depth of field that can be viewed in a single image because of the fixed focal length of single-element transduc- ers. An annular array with only five elements overcomes the limits of a single-element transducer by offering the image quality of a linear-array system but with the simplicity of a single-element system (Ketterling et al., 2005). Annular ar- rays allow axial focusing and, in essence, approximate a sin- gle-element transducer with a variable focal length. Figure 3 shows image examples of the human eye using a 20-MHz and a 40-MHz annular array (Silverman et al., 2011). Com- pared with the images in Figure 2, the annular-array images show a clear improvement in the depth of field and resolu- tion over the depth of field.
1 Riverside Research Institute and R. Silverman have an equity interest in ArcScan, Inc.
48 | Acoustics Today | Spring 2017
Figure 3. Human-subject ophthalmic images using custom, five-ele- ment annular arrays. a: A 20-MHz image of the full eye. The retina and anterior chamber were resolved in a single image, something not possible with a single-element transducer. The outline of the lens was also faintly visible. b: A 40-MHz image of the anterior chamber showing the cornea, iris, ciliary body, and sclera while the patient was looking off the axis. Because the annular array has an extended depth of field, the image quality is less sensitive to movement of the eye.
Small-Animal Imaging
HFU is used extensively for the imaging of mice in preclinical research including cancer, cardiovascular and development studies. Mouse embryo imaging plays an important role in developmental studies where embryos are studied for genet- ic developmental defects or for the effects of compounds on embryonic development (Foster et al., 2011). Ultrasound is the only imaging modality capable of noninvasive, real-time imaging of the mouse embryo in utero. Figure 4 shows an in vivo, in utero image of a mouse embryo on embryonic day (E)12.5, where E0.5 is defined as noon of the day after suc- cessful overnight mating, obtained with a VisualSonics 3100 imaging system using a 40-MHz linear array. By acquiring a stack of adjacent image planes that span the whole embryo (see http://acousticstoday.org/ketterling), an embryo can be visualized in 3-D. Figure 5 shows a volumetric representa- tion of whole embryos over a 5-day development period and
