
Page 37 - Fall_DTF
P. 37
5‘ r(M [XLk~'H'|(n1A' B
tmnulaasr ., . klnnnntrvn-at ,4!
3 W .4» nwmut '
: - '_ ‘ .
“backwards” refraction has led to wave phenomena being . T '" 5
called “backward waves.” In the context of the acoustic LWA, : . U‘ ‘
these negative effective properties can be utilized to achieve “ ‘Q _ H E : Dig)-_§;_
a negative refractive index. ,. 7.1,, n 3 agile; ;'- ,
._ we 2 , _
As we examine the concept of the LWA more closely within e . \ ix‘ 3”: 3.23:“
the context of acoustic metarnaterials, it becomes apparent I i .7‘ lflequzesrtiyftiltlfl
that the LWA configuration with an array of holes is a good 5“ ‘
starting place to incorporate meta.rnateria.l concepts. This ff‘ _ C
-wrtuusos.
geometry presents a classic configuration for analysis using a -an in "W N; £3: 17% l l A
transmission line approach, which is a simple model developed 5.; g in / as?
to represent an infinite series of discrete, frequency-dependent 5, ‘ § 3;. \\
elements. This approach can be used to analyze propagation “_j _K A in
and dispersion in several acoustic metarnateria.l structures. In E V,‘ _ ; 9 1‘ ; M 3 5
this scenario, mechanical elements, such as acoustic ports, act A ' ' — __ F'E“”e"‘y mm
as shunt inductances, or masses, and other elements, such as 3 ‘}‘Wf'1 L“
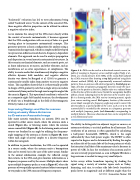
membmes’ act “5 "fies Capacitmm‘ °' °°ml’H““°°5' The Figured A‘ LWA: can lie used as u directienul ueeustie source m—
ability to Create rnedia that sirnu1taneousiY disPiaYs a ne8ati"e palrle of sweeping in frequency across multiple angles (Nuify et al..
effective dynamic hulk rnodu1us— and negative eifeotive 2013). a-c: Sound pressure levels (SPL) of the saundfield rutiiuted
density was shown by Bongard et al. (2010) to generate a by a LWA structure (line drawing at top left) predicted using finite
continuously variable index from positive to zero to negative element methods (FEM): I/if-' 9"P"”""’”“'"}’ ’“9“-5"’ed ’“'i’““”"
values. This capability showed that it is theoretically possible P"“‘":‘_f"”'_" "" ‘"”;'_'"‘_' Wm‘ "1e”t'C_"Ig:”_"“"t_’}" D_’“_:”df""7 ""
"12:.;::‘:i.:",:£.:.;:“;t;$::“i::;t.:$:;::;":;i.:,.:.::;f.
Continuously from Positive through leroto negative angles like ligrlllthe direetian af the incident wave (inside the waveguide); backfire
the array in Figure 1r This operational Condition is referred to defines u beum radiating hack ta the direction of the incident wave.
as a composite right-lleft-handed structure, the development B: in u listening made. the LWA receives incoming ucnustic signals
of was a breakthrough in the of glectrol-nag-agfic fmm SUIAYCBS emitting sound. Red square, Incutian of the acoustic
LWAS by Calm el al (2008) Zensatr. lrtslegi example frelillidlenc}/jingle map used ta_ca;v.e£t :22
lrec lanul u u spec a pm e n e scene, we as in . : e
improving Design and parfonnancaa scattered field is recorded by the antenna us a frequency speetrum
using 3 Leaky Wave Antenna with multiple frequency peuhs (red dianionds) earrespanding to
. multiplefieatures. These anedimensianul shees can lie compiled into
to Create an Acoustic Image a lwawmensinnui mm
Like many acoustic transducers, an acoustic LWA can be
operated i.ri either source mode, where the antenna emits a
murid (Figure 4A), or listening mode, where the amerma The ability to distinguish two adjacent targets or sources, or
senses a sound iidd (1-;ieure4B)_ In the la-sieuirig moda external antenna resolution, is a critical problem for all antennas. The
murees are localized in an angle by uulizirig the frequeuey_ resolution of an antenna is often quantified by calculating
angle mapping of the ammua as shown in Figure 43) inset’ a ha.lf-power beamwidth (HPBW), which is the angle
where each angle of arrival Couples to a disereie frequency subtended by these half-power angles. The HPBW is often
within die waveguide reported in degrees and is determined by finding the angles
_ _ _ _ _ on either side of the main lobe of the beam pattern at which
I“ addmon to Passwe locahzauon‘ the LWA can be operated the intensity is half that of the maximum value (a decrease in
in a source mode, where the antenna emits a beampattem . .
_ _ _ _ power of 3 dB). In fact, the resolution of an antenna and its
than can be slefled (as m the Case of the amve army)‘ Sumlar size are inversely proportional as seen in Figure 513 where a
to the animal echolocation example, the reflected energy he . . l .
_ _ _ _ ge antenna is needed to image very small objects.
then returns to the LWA and gives location information as a
frequency response read by the sensor. Multiple objects show Active arrays utilize beamform tapering by shading the
up as multiple frequency peaks, as seen in Figure 4C, where the signal using a variety of window tapers such as Tukey,
presence of two spatiallyseparated scattered objects correspond hamming, and sine, to reduce side lobe levels (sensitivity
to two peaks inthe LWA-measured frequency response. peaks lower in magnitude and at different angles than the
Fall 2013 | Acnullzlcl Tnday | as
