
Page 50 - Fall_DTF
P. 50
\I\Ihen 1'\Mo Wrongs Make
a Flight: Combining Aliased
Arrays to Find Sound Sources
Kathleen E. Wage Sparse array processing enables detection and localization afacimstic
Addms: saurces with fewer sensars than a more expensive uniform array.
Electrical and Computer Engineering
(ECE) Department Introduction
George Mason University Many applications require detection and localization of sound sources. For ex-
4400 University Drive ample, sonar operators seek to detect quiet submarines in the presence of loud
Fairfax, Virginia 22030 surface ships. Biologists aim to track vocalizing animals such as whales and birds
USA for population surveys. Video conference designers need to automatically track
Ema” speakers with the camera. A common way to detect and localize sources for appli-
. ' cations like these is to use an array of microphones (hydrophones for underwater
k.e.wage@ieee.org _ _ _ _ _ _ _ _
environments). Although a single omnidirectional microphone cannot identify
the propagation direction of the sound it receives, a collection of microphones can
be used to estimate the direction.
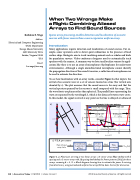
To see how localization with an array works, consider Figure la that depicts the
arrival of an acoustic wave at a set of sensors located on a line (the vertical axis
denoted by z). The plot assumes that the sound source is far away and that the
vertical aperture spanned by the sensors is small compared with the range. Thus,
the wave fronts are planar rather than spherical. The parallel lines representing the
wave are separated by the wavelength A, which is the distance between wave crests.
hi this model, the signal received at any point on the line is delayed or advanced
a) ‘ b) Sample ULA power patterns
‘ _E «Z Main lobe
sensars, 0 SA spacing
08
D a 4/Grating lobe Grating lalie4>
at — Tm in +
A 9 D 4 ‘ ‘ ‘ "
F“ E Side lobes ‘
0 2 :\ i \ i
‘ll ; \ l \ r m
D ‘ 1 . s ,
‘ 2) ’
U 2 (#.~‘€II~Ol’.~)[~)7ar‘lIIg]
i 0 5 D 0 5 i
u=cn5(’7l
e) ULA processor
Narmwband x C°“"e““°““‘ .v(un) P?“"“ S(un) Time
am dam 4. beanrfoinrer estimate “em in Sm,(u,,)
V W“(uo) l V V’ '4 E
Figure 1. a; Planewave arriving at twa linear arrays: a 9—serisar array (blue circles) with d
spacing and a 5—sensar array with 2d spacing (red circles). in Pawer patterns [P(u)]far these
arrays, assaming d = /l /2. 5: Black diagram shawing haw to estimate the power s arriving
fram alireetian uo asing riarrnwlzami imifwm line array (ULA) data. see text far aliseassian.
43 l AI:ouI:l:I -risuay l nilzois | volume14,issue3 @1I7l3AC0lJSIlCfll50Cl€tyQfAm€1'lCI1.All1lghtSTtStII/Ed.
