
Page 25 - WINTER2019
P. 25
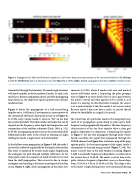
 Figure 6. Propagation of a half-second-duration impulse in a 250-meter deep ocean representative of the continental shelf at 10 Hz (left top) and 50 Hz (left bottom) and in a deep polar ocean (see Figure 3) at 10 Hz (right). Arrows, propagation direction; numbers, modal arrivals.
 transmitted through the boundary. The mode angle increases with mode number, as do the number of nodes. As such, each mode has a distinct propagation speed, and after propagating long distances, the dispersed signal separates into distinct modal arrivals.
Figure 6 shows the propagation of a half-second-long impulse out at 1,000 km in 2 environments, representative of the continental shelf and a deep polar ocean (as in Figure 4). At 10 Hz, only 1 mode (mode-1) exists or “fits” on the shal- low continental shelf. Note that number of modes that can fit depends on the frequency, water depth and temperature, and composition of the seafloor sediments (Frisk, 1994, p. 151). At 50 Hz, 5 propagating modes exist on the continental shelf. Additional modes enter at the critical or limiting ray angle, shifting the mode-1 angle closer to the horizontal.
In the shallow-ocean propagation in Figure 6, left, the mode-1 arrives first, followed sequentially by the higher order modes. This order is explained by steeper mode angles lengthening the analogous ray path through multiple reflections. In the deep polar ocean, the sequence of mode arrivals is reversed from the shelf propagation. This reversal is due to steeper analogous rays traveling at the faster sound speed of the deep ocean. Figure 6, right, shows propagation in the polar envi-
ronment at 10 Hz, where 8 modes exist now and mode-8 arrives well before mode-1. Inspecting the polar propaga- tion in Figure 6 in more detail, there is also a gap between the mode-1 arrival and what appears to be a mode-3, as if mode-2 is missing. In this illustrative example, the source is at a node of mode-2 and thus mode-2 was never excited. Because mode-1 does not have a node, its arrival should always be identifiable in a signal; it is special.
The travel time of a particular mode is the integrated recip- rocal of its propagation speed along its path and is both frequency and geographically dependent. The time-frequency characteristics of the San Juan impulse show a clear geo- graphic dependence to dispersion. Comparing the signals in Figure 7, the one that propagated through polar waters hardly resembles the signal that propagated through the SOFAR channel (see Figure 8 for a reference map of the prop- agation paths). In these spectrograms of the signal, mode-1 corresponds to the peak energy arrival (Figure 7, red). The mode-1 arrival time in the mid-Atlantic recording (Figure 7, left) is essentially frequency independent, as evidenced at the vertical line at 14:59:18. The mode-1 arrival time at the polar station is frequency dependent, seen as a linear slope from 15:19:35 at 3 Hz to 15:20:00 at 10 Hz. This slope is due to the mode-1 angle shifting closer to the horizontal (having
Winter 2019 | Acoustics Today | 25
