
Page 57 - Spring2020
P. 57
and Ice Data Center, 2019). The ice extent in winter is also declining, although more slowly.
The decrease in the observed Arctic sea ice area is directly correlated with anthropogenic CO2 emissions (Stroeve and Notz, 2018). The ice loss per ton of anthropogenic CO2 emis- sion is about 3 square meters during summer and slightly above 1 square meter during winter. Extrapolating these rela- tionships into the future, the Arctic will become ice free in the months of August and September when an additional roughly 800 ± 300 gigatons of anthropogenic CO2 have been released. The emission rate today is about 40 gigatons of CO2 per year. If this emission rate continues unchanged into the future, an additional 800 gigatons of CO2 will have been released in about 20 years.
Ice thickness is more difficult to measure than ice extent (Kwok and Untersteiner, 2011). Thickness estimates are avail- able from upward-looking sonars that measure ice draft (the distance from the ocean surface to the bottom of the ice) installed on submarines and moorings and from satellite altimeters (ICESat and CryoSat-2) that measure ice freeboard (the distance from the top of the ice to the ocean surface). Between the early submarine measurements (1958 to 1976) and the CryoSat-2 period (2011 to 2018), the average thick- ness over most of the deep-water portions of the Arctic at the end of the melt season decreased by 2.0 meters, or about 66% (Kwok, 2018). The most dramatic decrease has been at the North Pole where the average ice thickness at the end of the
melt period decreased by about 2.9 meters, from 3.8 meters to 0.9 meter (Kwok, 2018).
The presence of multiyear ice (i.e., ice that survives the summer melt season) is closely related to ice thickness and volume. Sea ice age can be estimated using a combination of satellite passive-microwave data and drifting buoys to derive the formation, movement, persistence, and disappearance of sea ice (Maslanik et al., 2011). The area covered by sea ice that was four years of age or older declined from 2,687,000 square kilometers in September 1984 (week 38) to 53,000 square kilometers in September 2019 (week 38; Figure 3; National Snow and Ice Data Center, 2019). The disappearance of mul- tiyear ice has affected not only the average ice thickness but also the pressure ridges and associated ice keels formed when ice floes collide. Old multiyear ice has larger pressure ridges than first-year ice, with ice keels that can extend down tens of meters. These deep keels are disappearing together with the multiyear ice.
Ocean Stratification
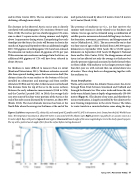
Warm, salty water from the Atlantic Ocean enters the Arctic through Fram Strait between Greenland and Svalbard and through the Barents Sea. This water sinks and forms the rela- tively warm Atlantic layer at depths of approximately 150-900 meters (Figure 4). (The density of sea water, and therefore the ocean stratification, is largely controlled by the salinity at the near-freezing temperatures in the Arctic Ocean.) The Atlan- tic water travels in a counterclockwise sense along the deep
Figure 4. Left three: temperature (T), salinity (S), and sound speed (C) profiles at 84°N, 28°E in the eastern Arctic Ocean from the 2013 World Ocean Atlas. The temperature maximum at about 300 meters is associated with the Atlantic layer. Right: geometric ray paths for an acoustic source at a 60-meter depth. Rays with positive (upward) and negative (downward) launch angles of the same magnitude give rise to the closely spaced ray pairs. The ray with a positive launch angle reflects from the surface before starting downward.
Spring 2020 | Acoustics Today | 57
