
Page 53 - Summer2020
P. 53
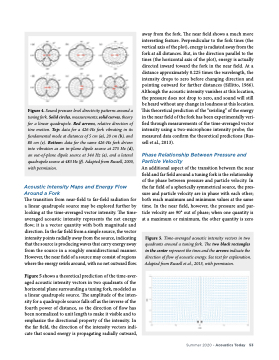
  Figure 4. Sound pressure level directivity patterns around a tuning fork. Solid circles, measurements; solid curves, theory for a linear quadrupole. Red arrows, relative direction of tine motion. Top: data for a 426-Hz fork vibrating in its fundamental mode at distances of 5 cm (a), 20 cm (b), and 80 cm (c). Bottom: data for the same 426-Hz fork driven into vibration as an in-plane dipole source at 275 Hz (d), an out-of-plane dipole source at 344 Hz (e), and a lateral quadrupole source at 483 Hz (f). Adapted from Russell, 2000, with permission.
Acoustic Intensity Maps and Energy Flow Around a Fork
The transition from near-field to far-field radiation for
a linear quadrupole source may be explored further by looking at the time-averaged vector intensity. The time- averaged acoustic intensity represents the net energy flow; it is a vector quantity with both magnitude and direction. In the far field from a simple source, the vector intensity points radially away from the source, indicating that the source is producing waves that carry energy away from the source in a roughly omnidirectional manner. However, the near field of a source may consist of regions where the energy swirls around, with no net outward flow.
Figure 5 shows a theoretical prediction of the time-aver- aged acoustic intensity vectors in two quadrants of the horizontal plane surrounding a tuning fork, modeled as a linear quadrupole source. The amplitude of the inten- sity for a quadrupole source falls off as the inverse of the fourth power of distance, so the direction of flow has been normalized to unit length to make it visible and to emphasize the directional property of the intensity. In the far field, the direction of the intensity vectors indi- cate that sound energy is propagating radially outward,
away from the fork. The near field shows a much more interesting feature. Perpendicular to the fork tines (the vertical axis of the plot), energy is radiated away from the fork at all distances. But, in the direction parallel to the tines (the horizontal axis of the plot), energy is actually directed inward toward the fork in the near field. At a distance approximately 0.225 times the wavelength, the intensity drops to zero before changing direction and pointing outward for farther distances (Sillitto, 1966). Although the acoustic intensity vanishes at this location, the pressure does not drop to zero, and sound will still be heard without any change in loudness at this location. This theoretical prediction of the “swirling” of the energy in the near field of the fork has been experimentally veri- fied through measurements of the time-averaged vector intensity using a two-microphone intensity probe; the measured data confirm the theoretical predictions (Rus- sell et al., 2013).
Phase Relationship Between Pressure and Particle Velocity
An additional aspect of the transition between the near field and far field around a tuning fork is the relationship of the phase between pressure and particle velocity. In the far field of a spherically symmetrical source, the pres- sure and particle velocity are in phase with each other; both reach maximum and minimum values at the same time. In the near field, however, the pressure and par- ticle velocity are 90° out of phase; when one quantity is at a maximum or minimum, the other quantity is zero
 Figure 5. Time-averaged acoustic intensity vectors in two quadrants around a tuning fork. The two black rectangles in the center represent the tines and the arrows indicate the direction of flow of acoustic energy. See text for explanation.
Adapted from Russell et al., 2013, with permission.
 Summer 2020 • Acoustics Today 53
