
Page 17 - Fall 2005
P. 17
55 50 45 40 35 30 25 20 15
210 200
190 180 170 160 Longitude
150 140 130
Observing ocean climate
At the International Conference on the Ocean Observing System for Climate: OCEANOBS 99 in St. Raphael, France (18–22 October 1999), Dushaw et al.9 summarized the appropriate role for acoustic tomogra- phy in observing ocean climate. Some preliminary planning had previously been done for thermometry systems in the Atlantic, Arctic, and Indian Oceans. More recently, planning for the National Science Foundation ORION global network of moored- buoy observatories and the ORION cabled regional observatory has included provision for the data telemetry, power, and precision timing needs of acoustic thermometry, which would supplement the spot measure- ments at the moorings with measure- ments of ocean temperature between the moorings.10 One particularly intriguing possibility is that acoustic transmissions between the global moored-buoy observatories might provide measurements of the variable ocean heat content in the abyssal ocean. Systematic measurements of deep-ocean temperature currently exist at only a few locations in the world ocean, and these few time series do not show any consistent pattern. We need to understand the processes
that bring heat into the abyssal depths if we are to under- stand the role of the ocean in storing heat and the impact of
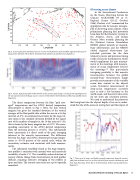
Fig. 5. Acoustic path from the Kauai source to receiver k with positions of the available Argo floats during a 10- day period in fall 2003. (From Ref. 8 © 2004 Institute of Electrical and Electronics Engineers.)
Fig. 6. Sixteen Argo float profiles within 300 km of the acoustic path during a 10-day period superimposed on the ray trajectories from the Kauai source to receiver k. (From Ref. 8 © 2004 Institute of Electrical and Electronics Engineers.)
The direct comparison between the float “path aver- aged” temperatures and the ATOC derived temperature measurement is shown in Fig. 7. Here, the thin vertical magenta bar gives the standard deviation of the vertical averages of the float profile data within the area in a 10-day interval, ±0.6oC. An estimated uncertainty for the Argo vol- ume mean is this standard deviation divided by the square root of the number of samples in the 10-day interval (~20); this is shown by the heavy magenta bar, ±0.15oC. The corre- sponding uncertainty in the ATOC-derived temperature from the inversion process is ±0.02oC. This substantially lower uncertainty is a direct result of the path averaging inherent in the acoustic measurement. The difference between the Argo- and ATOC-determined average temper- atures is ~30–50 percent of the annual cycle, within the uncertainty estimates and consistent with both measure- ments.
The substantial variability found in the Argo tempera- ture profiles is consistent with internal wave and mesoscale variability of order 1oC. This variability makes detection of oceanic climate change from measurements of local profiles difficult, requiring extensive averaging of the profiles in space and time. The acoustic time series are a priori spatially smoothed.
Fig. 7. Time series of range- and depth-averaged temperature along the acoustic path from the Kauai source to receiver k derived from acoustic thermometry and from Argo float data. (From Ref. 8 © 2004 Institute of Electrical and Electronics Engineers.)
Acoustic Remote Sensing of Ocean Gyres 15
Latitude
