
Page 16 - Jan2013
P. 16
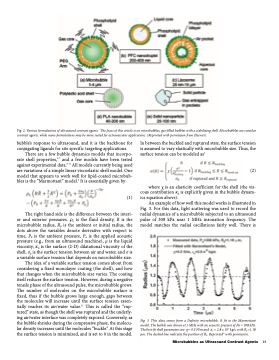
                  Fig. 2. Various formulations of ultrasound contrast agents.1 The focus of this article is on microbubbles, gas-filled bubbles with a stabilizing shell. Microbubbles are vascular contrast agents, while nano-formulations may be more suited for extravascular applications. (Reprinted with permission from Elsevier).
bubble’s response to ultrasound, and it is the backbone for conjugating ligands for site specific targeting applications.
There are a few bubble dynamics models that incorpo- rate shell properties,2-7 and a few models have been tested against experimental data.8-11 All models currently being used are variations of a simple linear viscoelastic shell model. One model that appears to work well for lipid-coated microbub- bles is the “Marmottant” model.5 It is essentially given by:
(1)
The right hand side is the difference between the interi- or and exterior pressures. rL is the fluid density, R is the microbubble radius, R0 is the ambient or initial radius, the dots above the variables denote derivative with respect to time, P0 is the ambient pressure, Pa is the applied acoustic pressure (e.g., from an ultrasound machine), μ is the liquid viscosity, κS is the surface (2-D) dilatational viscosity of the shell, σ0 is the surface tension between air and water, and σ is a variable surface tension that depends on microbubble size.
The idea of a variable surface tension comes about from considering a fixed monolayer coating (the shell), and how that changes when the microbubble size varies. The coating itself reduces the surface tension. However, during a negative tensile phase of the ultrasound pulse, the microbubble grows. The number of molecules on the microbubble surface is fixed, thus if the bubble grows large enough, gaps between the molecules will increase until the surface tension essen- tially reaches its air/water value.12 This is called the “rup- tured” state, as though the shell was ruptured and the underly- ing air/water interface was completely exposed. Conversely, as the bubble shrinks during the compressive phase, the molecu- lar density increases until the molecules “buckle.” At this stage the surface tension is minimized, and is set to 0 in the model.
In between the buckled and ruptured state, the surface tension is assumed to vary elastically with microbubble size. Thus, the surface tension can be modeled as5
(2)
where χ is an elasticity coefficient for the shell (the vis- cous contribution κS is explicitly given in the bubble dynam- ics equation above).
An example of how well this model works is illustrated in Fig. 3. For this data, light scattering was used to record the radial dynamics of a microbubble subjected to an ultrasound pulse of 308 kPa near 1 MHz insonation frequency. The model matches the radial oscillations fairly well. There is
    Fig. 3. This data comes from a Definity microbubble. It fit to the Marmottant model. The bubble was driven at 1 MHz with an acoustic pressure of Pa = 308 kPa. The best-fit shell parameters are χ= 0.5 N/m and κs = 2.8 x 10⁻⁹ kg/s, with R0=1.18 μm. The dashed line indicates the position of R0. Reprinted10 with permission.
Microbubbles as Ultrasound Contrast Agents 15
